Channel indicators are popular tools in technical trading. You can use them either as a primary trigger or confirmation for your entry. Whether you apply discretionary or automated trading, a channel indicator may have a place in your system.
In this article, you will learn about our best four-channel indicators. Some of them might be familiar to you, or you have used them on and off. If you are a new trader, you might pick one or two indicators from this list and add them to your trading arsenal.
What is a channel indicator?
If you trade price action, you know that you can track price movement with two trend lines or two horizontal lines. You can use two trend lines to follow the price action of a trending market. Meanwhile, you can use two horizontal lines to mark a ranging market’s support and resistance boundaries.
While trend lines and horizontal lines can create price channels, this is not the type of channel being discussed here. A channel indicator creates a channel automatically without using trend lines or horizontal lines. As the market moves forward, the indicator updates the channel to reflect the change.
A channel indicator often draws two bands:
- One above the price
- Another below the price
Sometimes, it creates three bands. Depending on the type of channel indicator, the price may stay inside or outside the bands during normal market conditions. Like moving averages (MA), channel indicators can tell you the trend of the active chart by looking at the slope of the bands.
Top 4 channel indicators
This section presents the four best channel indicators in our list. Here you will get insights as to how best to use these indicators, not the number of ways you can utilize them.
Bollinger Bands
Bollinger Bands (BB) create an envelope on the chart that expands and contracts based on market volatility. The traditional interpretation is that a market is overbought if the price touches the upper band or oversold if the price touches the lower band. However, you must have figured out that this is not a tradable idea.
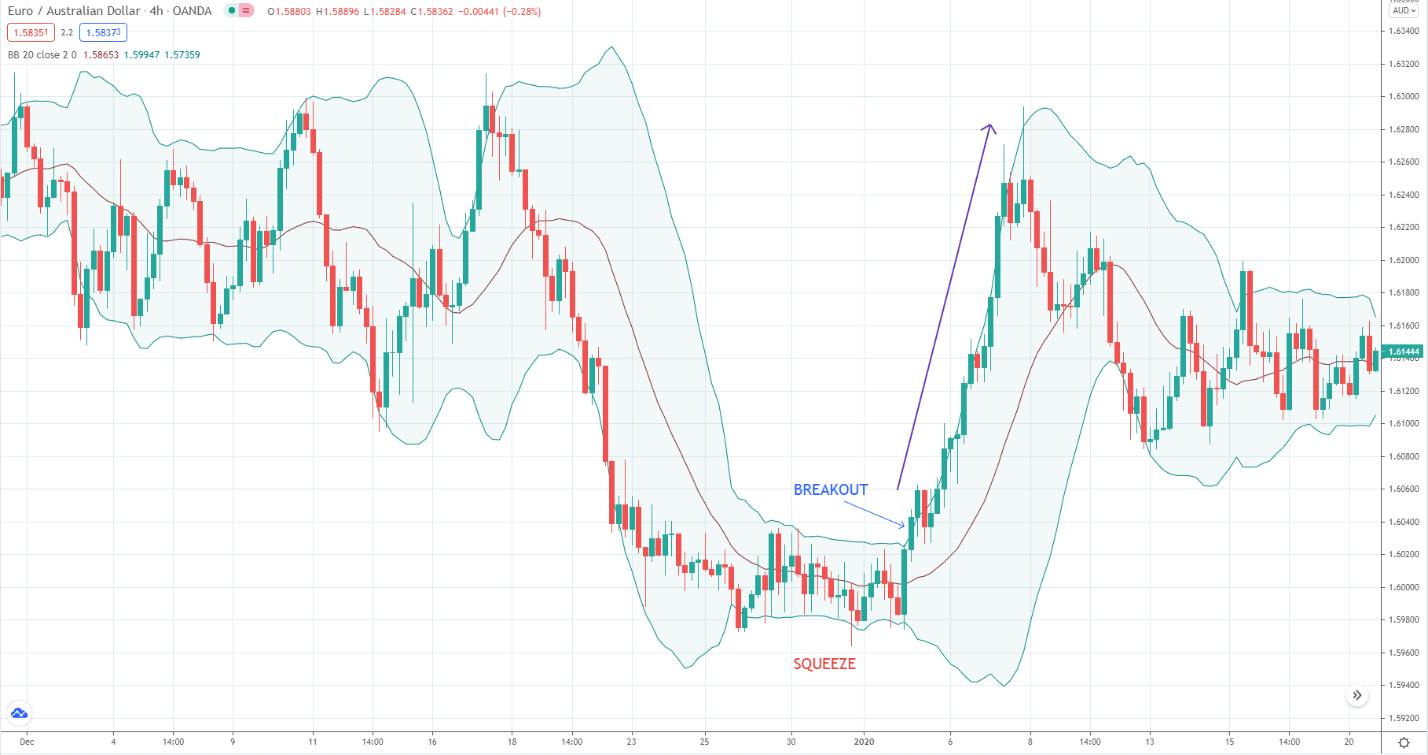
You can use BB in many ways. Perhaps the most effective use of this indicator is in breakout trading. This occurs when the price closes below the lower band or above the upper band. Still, this signal is not reliable. What you want to see is a price breakout after a squeeze.
In terms of probability, this type of trading signal has a higher win rate than other calls provided by the BB. In addition to the high success ratio, you can expect to make many pips with this entry. This is because a solid and lengthy price movement often follows the signal.
Refer to the above H4 EUR/AUD chart. Look at the squeeze that presaged the eventual upside breakout and the ensuing price rally. That is the power of the squeeze-breakout combination.
Keltner channel
Like the BB, the Keltner channel contains three lines. While the middle line is an EMA (commonly 14 periods), the outer lines are a factor of the average true range (ATR). Since the ATR is a volatility indicator, the Keltner channel expands and contracts based on market volatility.
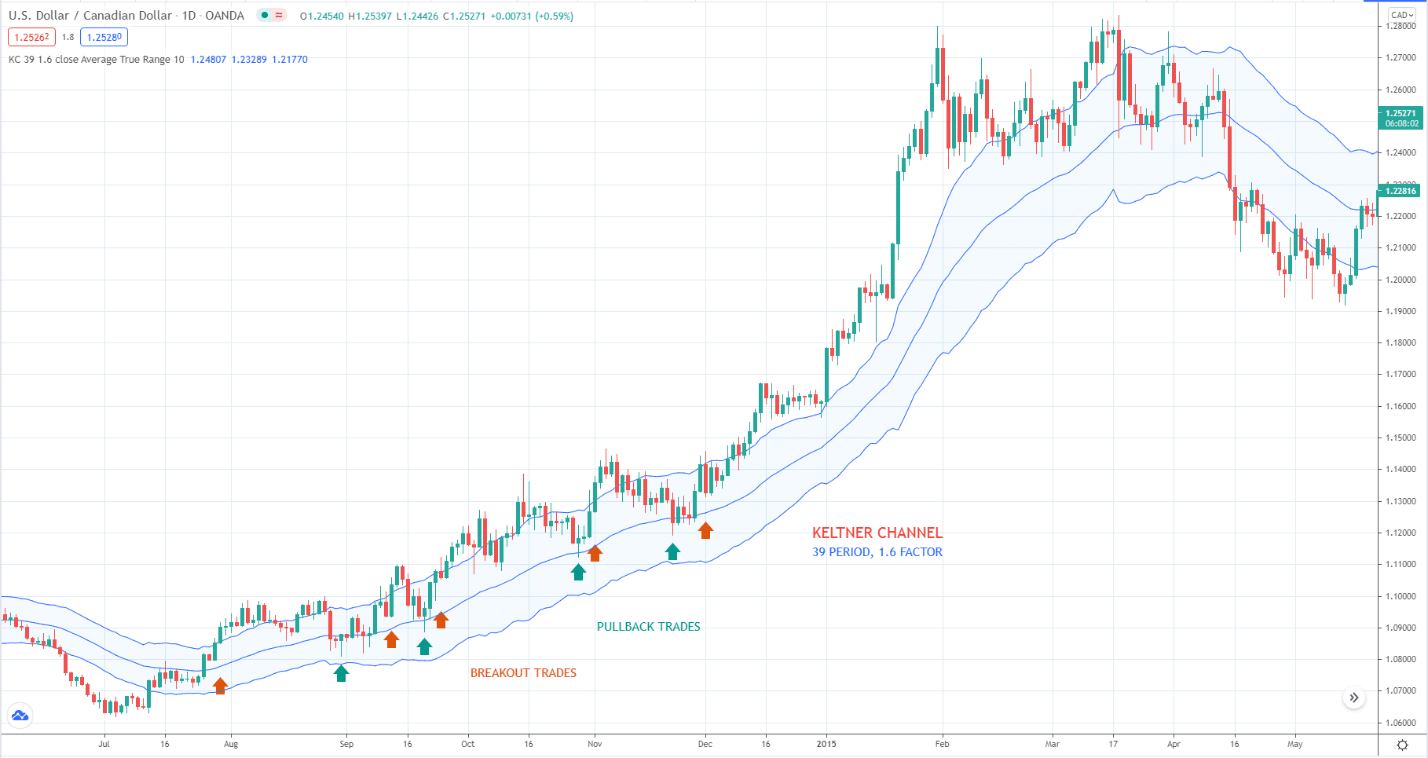
Because an EMA forms the centerline of the Keltner channel, you can use it to trade with the trend. This is where the Keltner channel works best. When a market is strongly trending, you will notice that price hugs the outer line of the channel. At other times, the price will use the center line as support or resistance while moving in the trend direction. You can take trend trades in both situations.
The above daily USD/CAD chart shows potential entries along with the trend. As you can see, you can take pullback trades and breakout trades using the Keltner channel. While you may use the default setting of 20 EMA and 1 factor, the best configuration is 39 EMA and 1.6 factor, in our opinion.
The best way to find out which setting is best for you is through your manual backtesting.
Moving average envelope
MA envelope is an indicator containing two lines, one below MA and another above it. The standard type of MA used is simple or exponential. After the platform determines the MA value, it defines the outer lines as a certain percentage of the MA value. Typically, the shift used is one percent. While it seems like the envelope expands and contracts, it is just an illusion. The outer lines maintain a constant distance from the centerline.
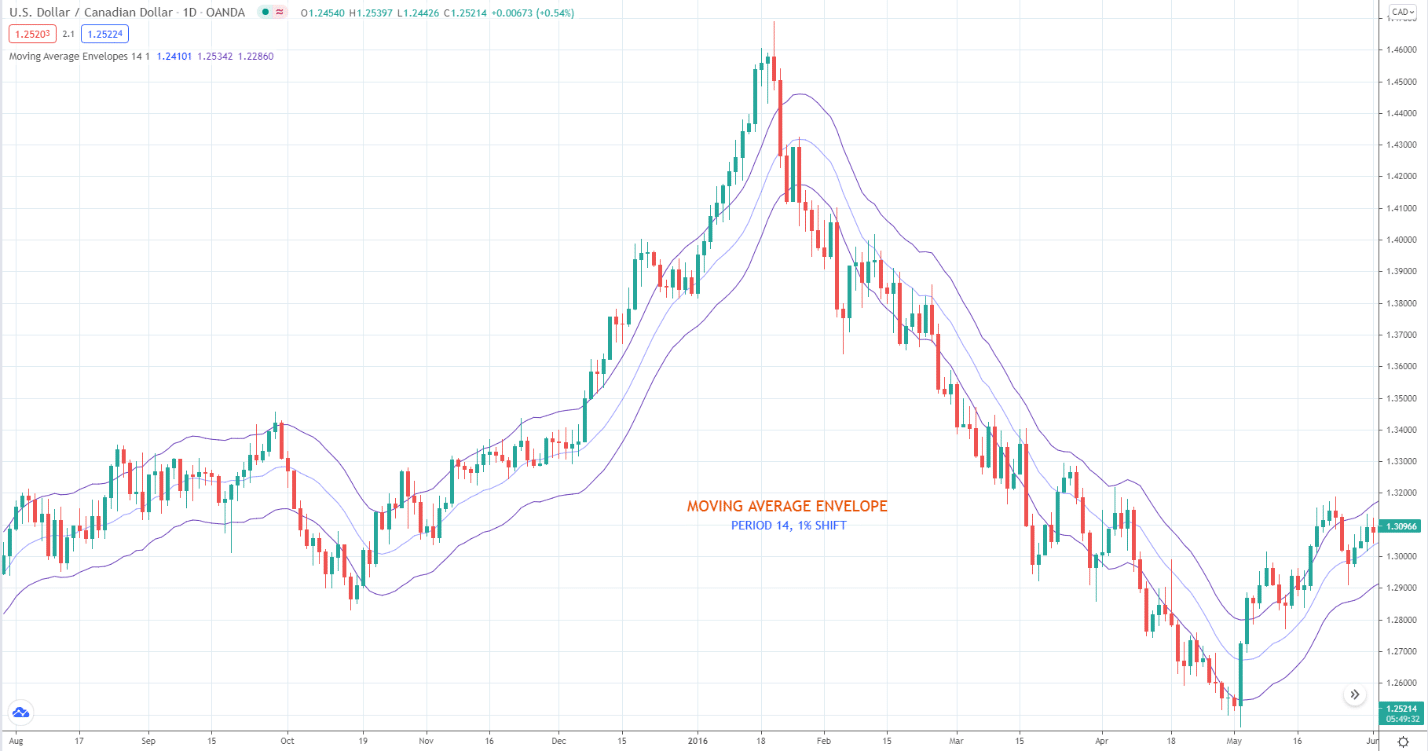
You can interpret an envelope in two ways.
- First, you can use it to analyze the strength and direction of the trend.
- Second, it can tell you the relative value of the price, that is, overbought or oversold.
The second line of thought is similar to the traditional interpretation of BB. You can use an envelope in much the same way as you would the Keltner channel in trading.
The above chart shows that the price tends to cling to the outer band if the trend is powerful or bounces off the middle line when the trend is less intense. Which indicator is more compelling is entirely up to your judgment based on your investigation.
Moving average channel
You might think the MA channel is similar to the MA envelope discussed above. This is not true at all. You might not have heard of this channel in the past, as many traders do not use it. Only a small group of traders uses this tool. It is not even a separate technical indicator, to begin with. You can create this channel yourself in your trading platforms such as MetaTrader or TradingView.
Refer to the above daily USD/CAD chart.
- To create an MA channel, plot two MAs of the same type.
- Apply one to the high price and the other to the low price.
- The two MAs should have the same length or period. We use 10 SMA in the below example.
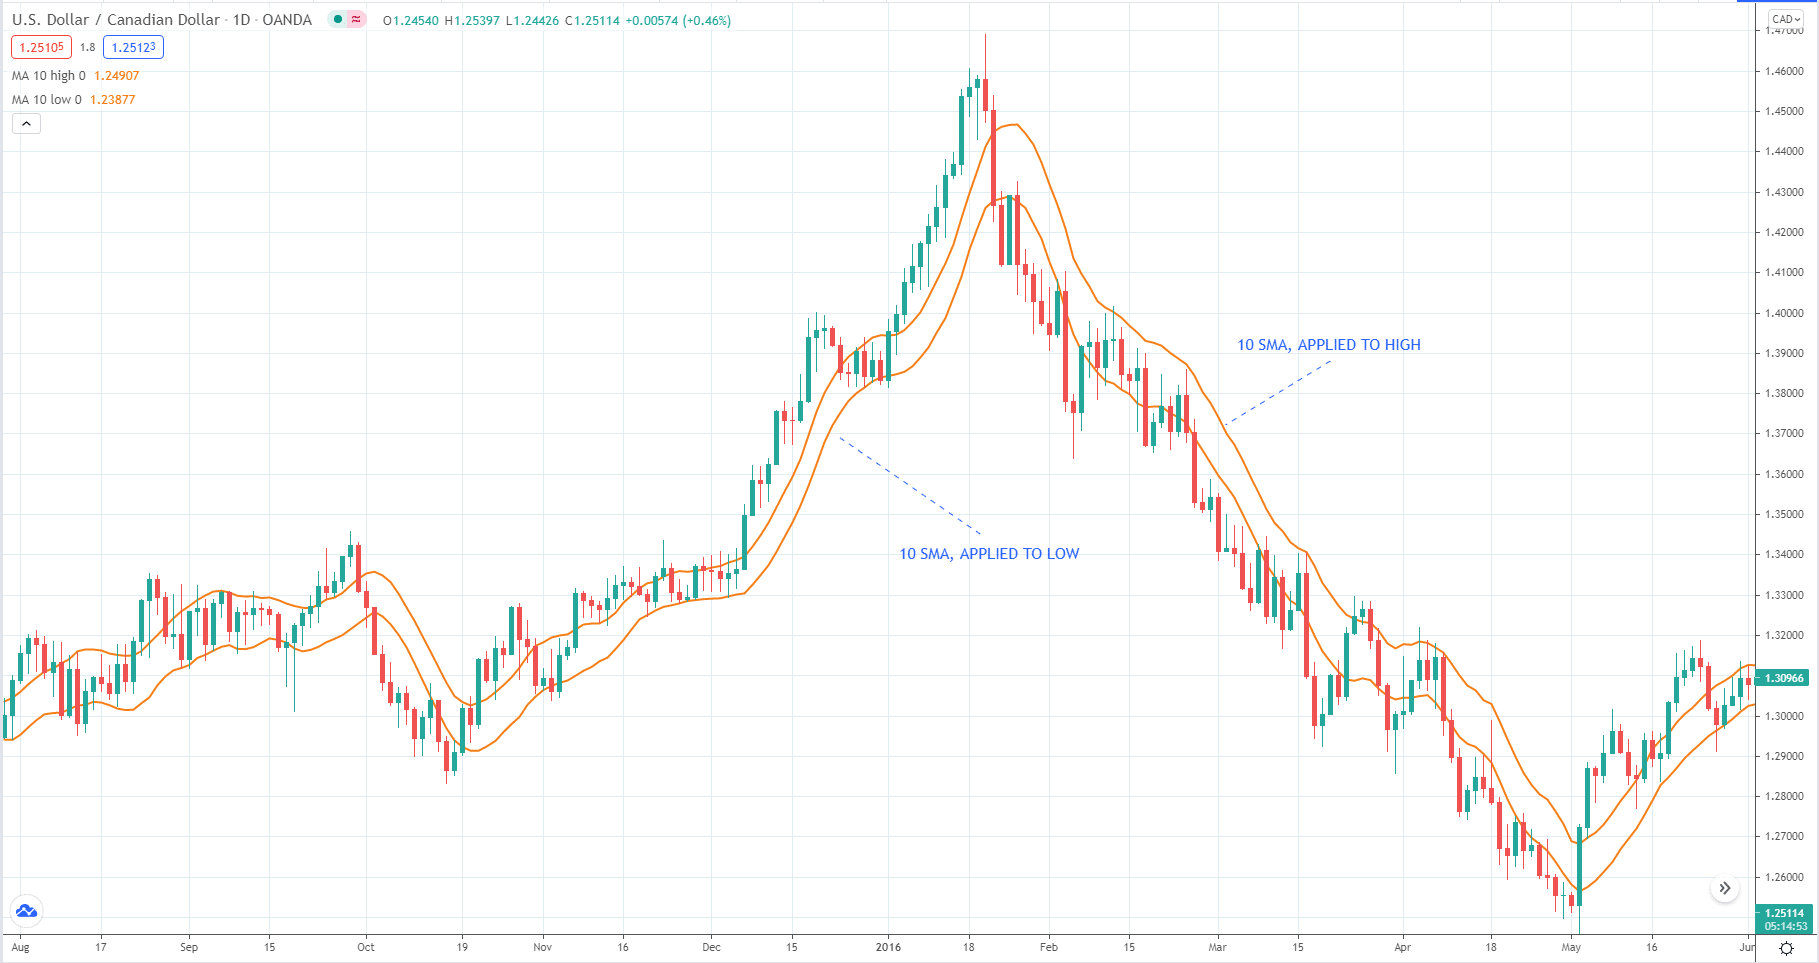
As simple as it looks, an MA channel is a powerful tool for manual trading. You can use it to detect the trend and enter trades along with that trend. When a market is trending, it often stays above the upper channel or below the lower channel.
As long as the price is on one side or within the channel, you can keep any open trade as-is until the price breaks out and goes the other way. Typically, the MA channel is an entry trigger to some other trading systems, manual or automated.
Final thoughts
Now you have learned about four-channel indicators that you can add to your trading repertoire. Of course, you will not use all of them simultaneously, else clutter your chart. Just pick one or two that resonate well with your strategy. You might not know how the channel indicators will impact your trading until you do.