There are four trading styles in any form of trading:
- Scalping
- Day-trading
- Swing
- Positional trading
Out of these trading styles, you will find there are many traders into full-time day-trading. Talking about all the trading forms in forex, in brief, starting with scalping — a form of trading where you enter and exit a trade quickly after you profit from the market.
In day trading, you make a profit and loss in a day trading session. Both of these trading styles here — scalping and day-trading is a stressful form.
Swing trading and positional trading, on the other hand, is a bit relaxable form. In swing trading, you will take a trade and keep it running for a week or two, while in positional trading, you will take a trade and hold it for long, say a month, three months, six months, or longer.
If you are interested in learning swing trading, especially when your favorite pair is GBP/JPY, this article is for you.
What is the swing trading strategy?
It is a form of trading that concentrates on executing more modest profits in the short term, bullish or bearish trends, and cutting losses quickly. Now you must think that taking smaller profits won’t help, but it does. Consistency is the key in swing trading; here, you will compound your profit if you make these small profits consistently over time.
For any strategy to work for you, you need to decide what profit you need from the market and how much you can risk to make it. We will not have too many tight goals but let’s have a modest goal of making 6% to 8% profit a month from this swing forex trading strategy.
Now, of course, this 6%-8% won’t be sufficient or can drastically change your life, but again gaining this return consistently with compounding can make you rich.
Swing trading GBP/JPY using technical analysis
Are you wondering why GBP/JPY? It is a volatile currency pair and moves in one direction for a longer time, suitable for swing trading.
There are mainly two types of trading analysis you can use to trade the market. One is fundamental, and another one is technical analysis.
Both of the analysis uses a different approach to trade:
- In fundamental analysis, you use news and events.
- In contrast, in technical analysis, you use various indicators and price movements to trade the market.
In this piece of article, we will learn how to swing trade GBP/JPY using technical analysis. Naked trading is a technical analysis that we will use in this strategy.
- First, you need to mark your dynamic support and resistance.
- Then you will analyze the market trend, and it will be easy to do on a daily time frame.
- Once you have figured out the overall market trend, you will start finding the price pattern like a double top, double bottom, head & shoulder, and so on.
You will gain an added advantage if these price patterns have an additional reversal or continuous candlestick formation. To know this in more detail, let us look into the bullish and bearish example below.
Bullish example
The first thing to do while swing trading is always to use a higher time frame, starting from weakly followed by daily and 4hr. The lower time frame does not have much significance in swing trading. Now we use price action on a daily time frame and match it with an indicator for extra confirmation.
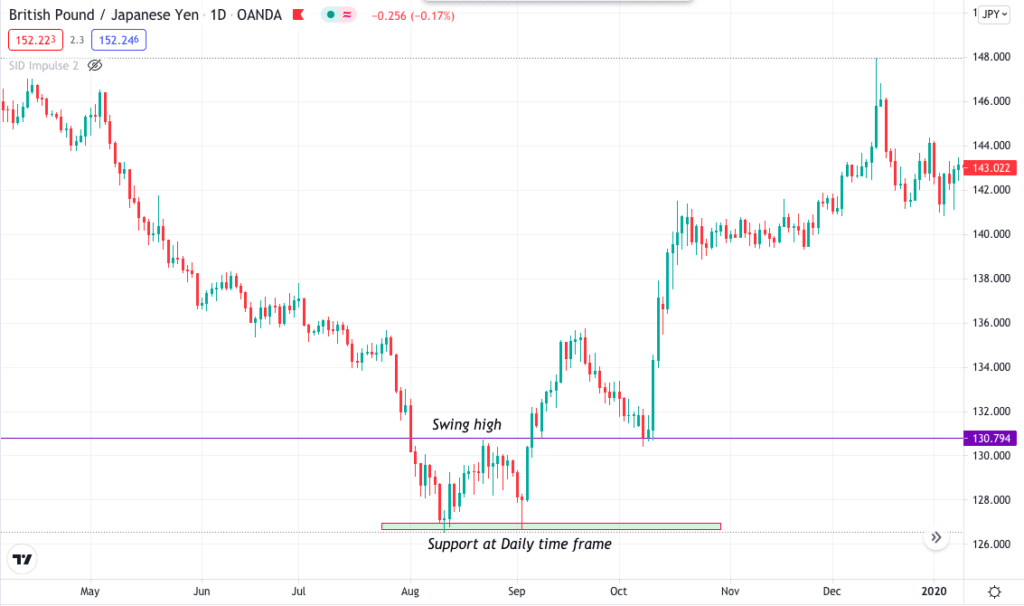
As you can see in the GBP/JPY daily chart below, we have the price making a double bottom, which is valid when the price touches the support twice and does not break the low. This means that the market does not have more sellers, and it could be a potential reversal and entry of buyers.
Also, you can see an excellent pin bar candle with a massive tail at the back, which gives a more accurate signal.

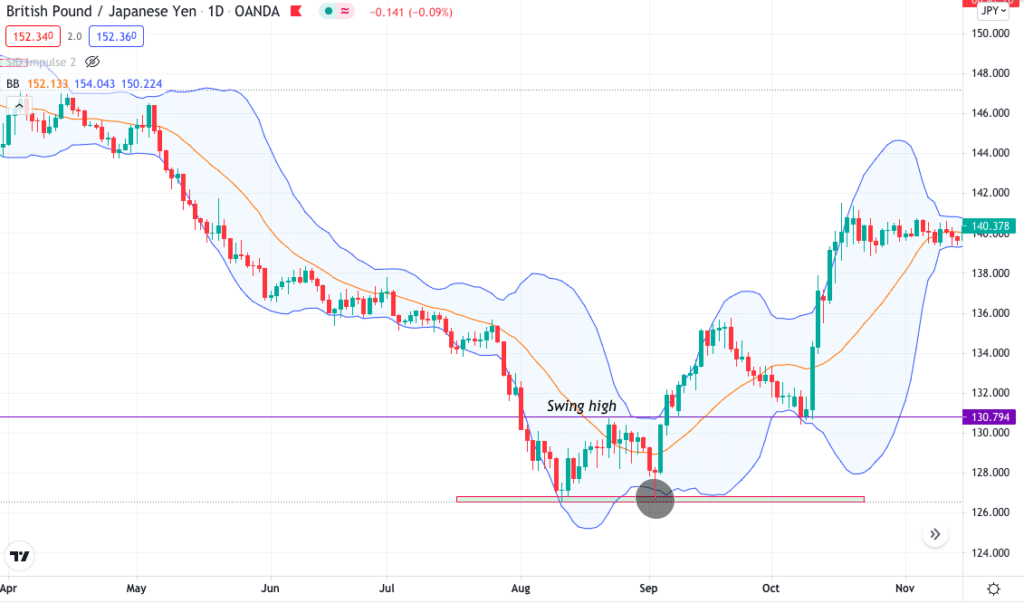
In addition to the double bottom, we also have a buy signal with a Bollinger Band. The pin bar candle is formed at the support of the Bollinger Band after piercing it. This here is an additional confirmation for a buy. Remember, do not always take the trade by just following the indicator blindly.

Bearish example
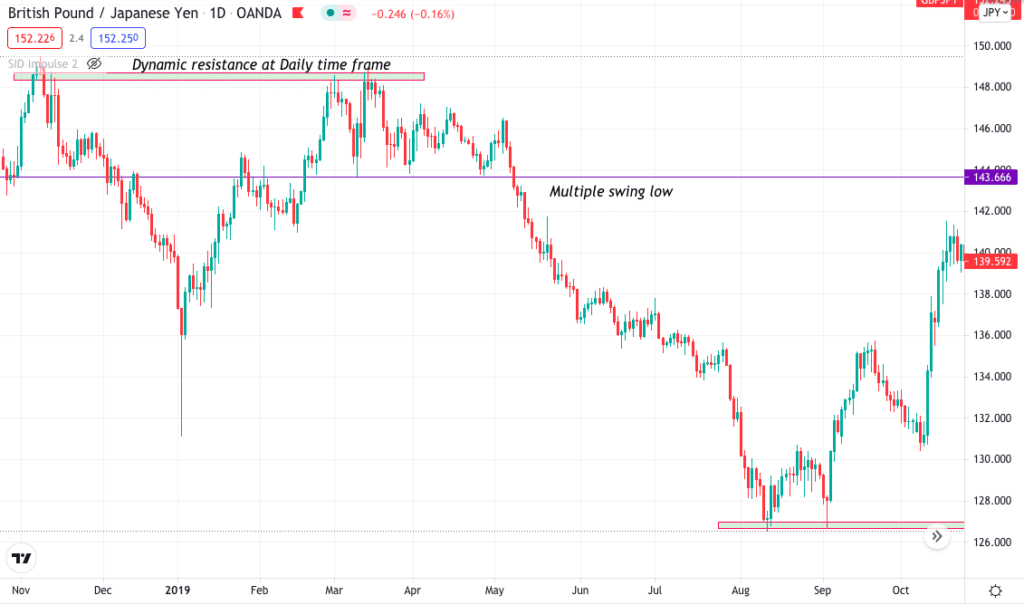
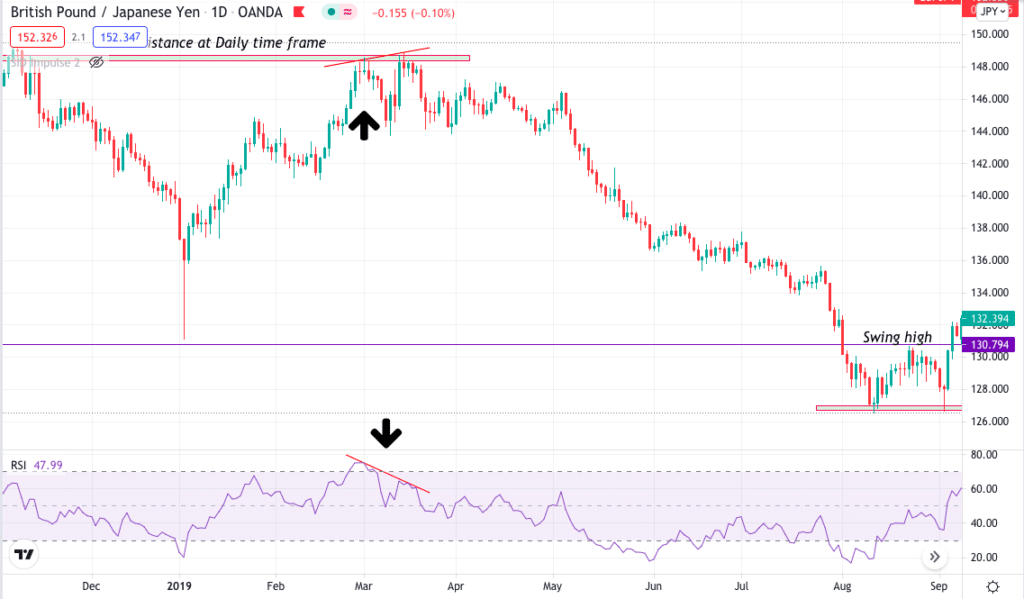
In the GBP/JPY daily chart below, you can see the price was getting rejected continuously and could not break the support. Here the price shows the buying pressure is less, and sellers might enter anytime soon. At the same time, we have a double top formation, which is valid when the price touches a resistance twice.

Here on the chart, the price was making a higher high, higher low, while on the RSI, you can see the price line making higher high and lower high. Also, you can see multiple candle rejections with an extra confirmation on the RSI showing divergence. This condition here shows market reversal is due soon.
Entry
Entry depends on your trading style. If you are a conservative trader, you may choose to wait for additional confirmation and enter at the retest. Whereas if you are an aggressive trader, you may choose to enter right after the break of swing high for bullish and break of swing low for bearish.
Holding position
You can hold the position till you are satisfied with the profit or wait for the next dynamic resistance or resistance on a daily time frame.
Stop loss
Your stop loss should be at the nearest swing low at a 4H time frame.

Final thoughts
Swing trading is exciting, but sometimes it tests patience as it will need you to be in the trade for a long time, and you might see the trade running for a long time.
Swing trades are somewhat easy to catch due to less noise on the higher time frame. You can increase your winning strike drastically when you use price action and even get additional confirmation of some indicator in any form of trading.
At last, you must understand everything takes time; similarly, getting good at trading a specific strategy also takes time. You will have to be patient enough for a trade setup and only enter when you have valid points that go with your protocol.