A flag pattern on a trading chart is represented by a short-term countertrend visible in the lower time frame. The flag is a minor pullback, and a flagpole is the continuous market movement.
Traders can use it in any time frame, but a lower-time frame is considered the best. The pullback typically should not exceed 35% while forming a flag. The best part is you can use flag patterns in any financial market.
Do you desire to learn how to trade this pattern and acquire good profit? Let’s get the information.
What is a flag pattern?
In trading, you can either find and trade reversal or continuation. A flag is a continuous pattern that is found easily on the trading charts. It got such a name because of its similar lookalike to a flag on a flagpole. It is formed when the price moves powerfully in any direction, followed by a regular and slanting symmetrical pullback.
There are two types of flag patterns, which have similar forms but differ in market direction and subtle differences in volume pattern. Both look like sloping rectangles framed by two trendlines.
- A bearish is formed when the price moves downwards, consolidates diagonally, and breaks the support trendline.
- A bullish is formed when the price moves upwards, consolidates diagonally, and breaks the resistance trendline.
The price, when the support or resistance trendline is the time for entry into the market.
How to trade with the flag pattern trading strategy?
These patterns require the patience to wait for the flag to form and plot the upper and lower trendlines. These will contain your entry and stop levels. It is best to use a momentum indicator like stochastic to time your entries, but we will use pure-price action to trade the flag pattern.
Bull flag trade setup
It represents an upward market movement. It occurs due to the weakness of bulls who before were pushing the price up. As a result, there is a correction, which signals that the price will keep rising.

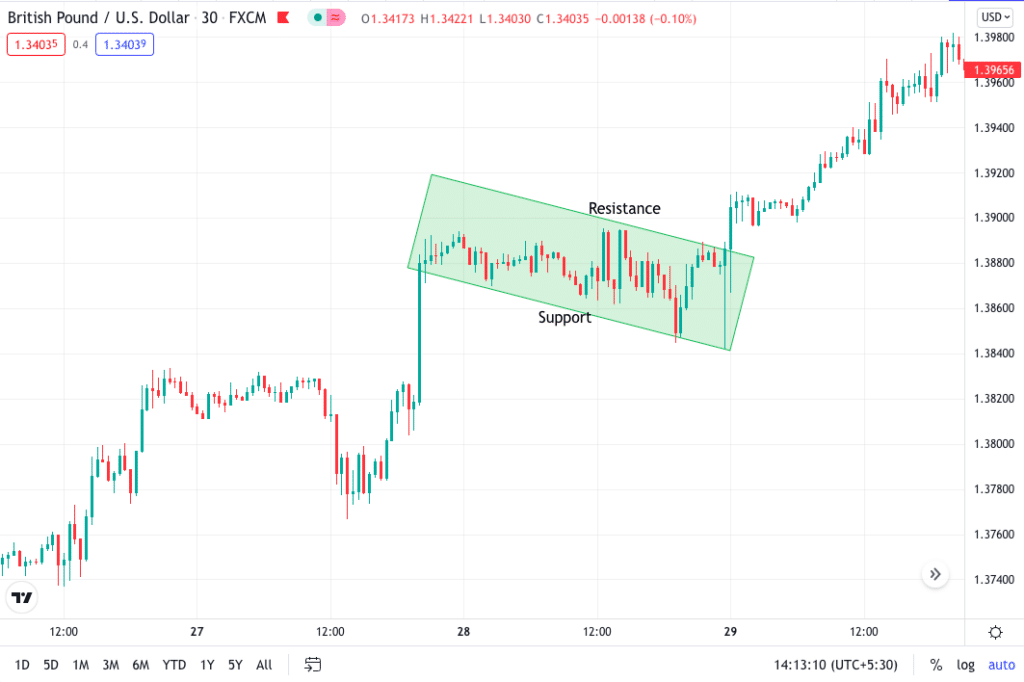
In the above GBP/USD 30min time frame, you can see the price was moving up and, on the way, made a pullback; however, the pullback was minor; the price oscillated between the support and resistance trendline.
When the price touched the support for the third time, you could see the buyers pushing the market up. This, however, happens after the break of the bullish flag. Here the big bullish candle is the flagpole, and the pullback is the flag pattern.
A thing to remember is to be an excellent bullish flag pattern; the pullback has to be not more than 35%-38%. To take the trade, you will have to move to the lower time frame.

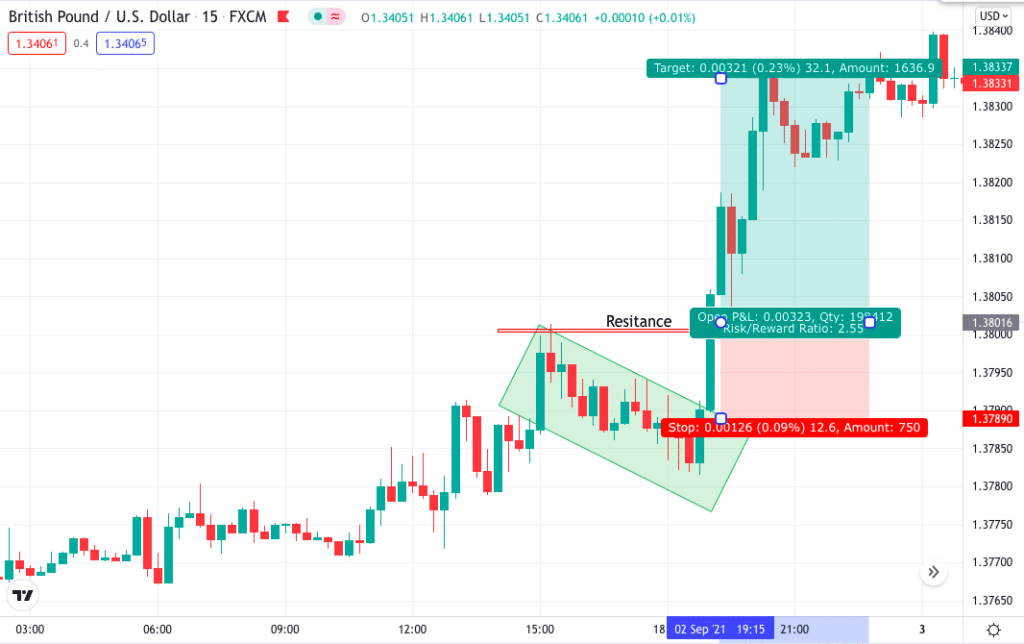
On the lower-time frame 15min, you can see the price breaking the swing high; the price also broke the flag. The price then came back to retest the break zone giving a fantastic risk: reward opportunity.
Entry
If you are an aggressive trader, you can enter the trade once the price breaks the recent high or the bullish channel if a moderate risk-taking trader. Remember not to enter the trade when the candle is still burning.
Take profit
You can place your take profit with 1:2 risk: reward.
Bear flag trade setup
A bearish flag represents a downwards market movement. It occurs due to the weakness of the bearish, who before were pushing the price down. As a result, there is a correction, which signals that the price will keep declining.

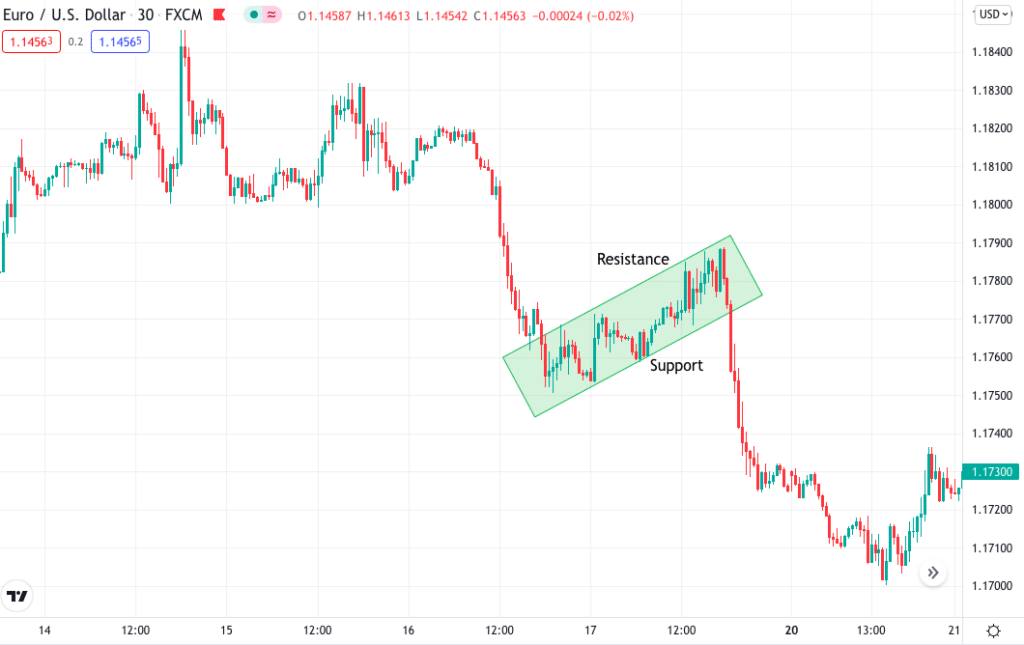
In the above EUR/USD 30min time frame, you can see the market made a drastic downfall movement and then has a correction that moved slightly up. The price also broke the previous high, stating the market could move up, but after a short-term move, the market broke the bearish flag channel and came down.
The market makes such a movement to collect the orders, and once it is done, the market again follows their movement as usual. Always keep in mind that the pullback must not be more than 35%-38%.

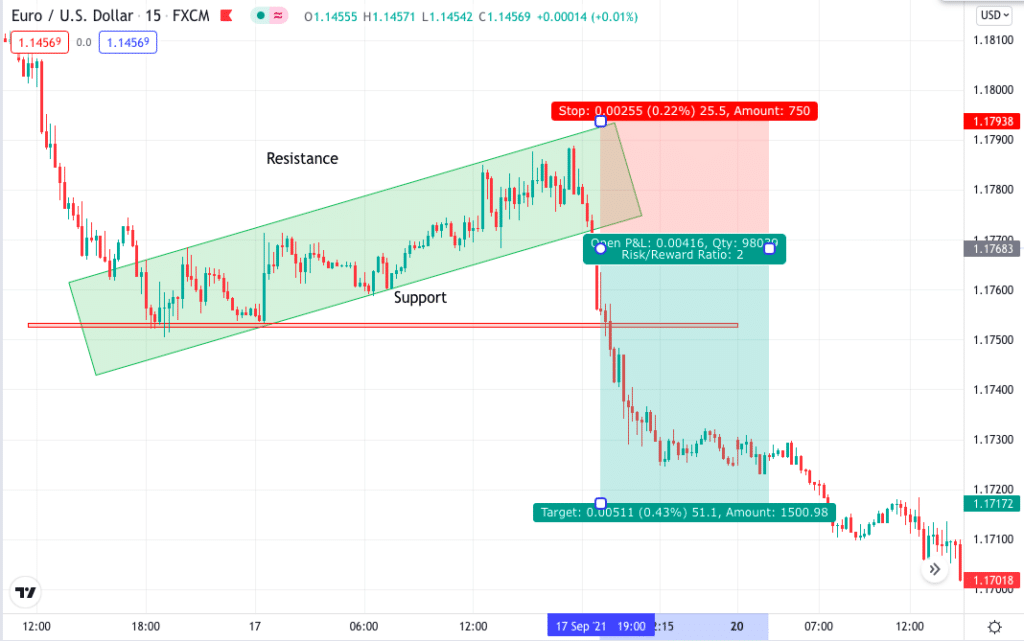
To take the entry and look for SL and TP, you have to come to a lower time frame, in our case, 15min. Now you will first make the major support zone as this is the place where we will be sure of the trade if market moves break it. Looking for a sell trading opportunity after the break of the flag is also a good option.
Entry
If you are an aggressive trader, you can enter the trade once the price breaks the recent low or the bearish channel if a moderate risk-taking trader.
Take profits
You can place your take profit with 1:2 risk: reward.
Are these strategies profitable?
Yes, the flag pattern is useful and works most of the time. Unfortunately, you cannot just look into the flag pattern and take all the trades as the market makes fake setups too. Traders must wait for the full breakout of the structure, either bearish or bullish flag.
Pros & cons
Both patterns are easy to recognize but have some advantages too when it comes to usage. Look into the pros and cons of using the flag pattern given below.
| Pros | Cons |
| Useful in any asset, including stocks The flag pattern is easily recognized, and you can use it for any financial asset, be it stocks, FX, or even crypto. | Difficult to distinguish from the rectangle pattern A lot of patterns are formed on the chart, especially the different trendline patterns. The flag pattern is similar to the rectangle pattern and sometimes different to differentiate. |
| You can find it in any time frame You can find flag patterns in any time frame; the higher, the better. | Not all signals work Trading signals are probability, and not all work 100%. Similarly, the flag pattern sometimes gives wrong signals. |
| Provides traders with a signal on the continuation of the uptrend The flag is a good pattern that signals a continuation of the market trend. When the price is breaking the support or resistance trendline, it offers good risk: reward too. | Not easy for beginner traders These patterns can form much often in any time frame. Too much information is not good for beginner traders. |
Final thoughts
This pattern is easy to recognize and use on any financial market chart. As known, the best move in any trading is to follow the market trend and not go against the movement until you are a professional. It helps you trade the trend continuation.