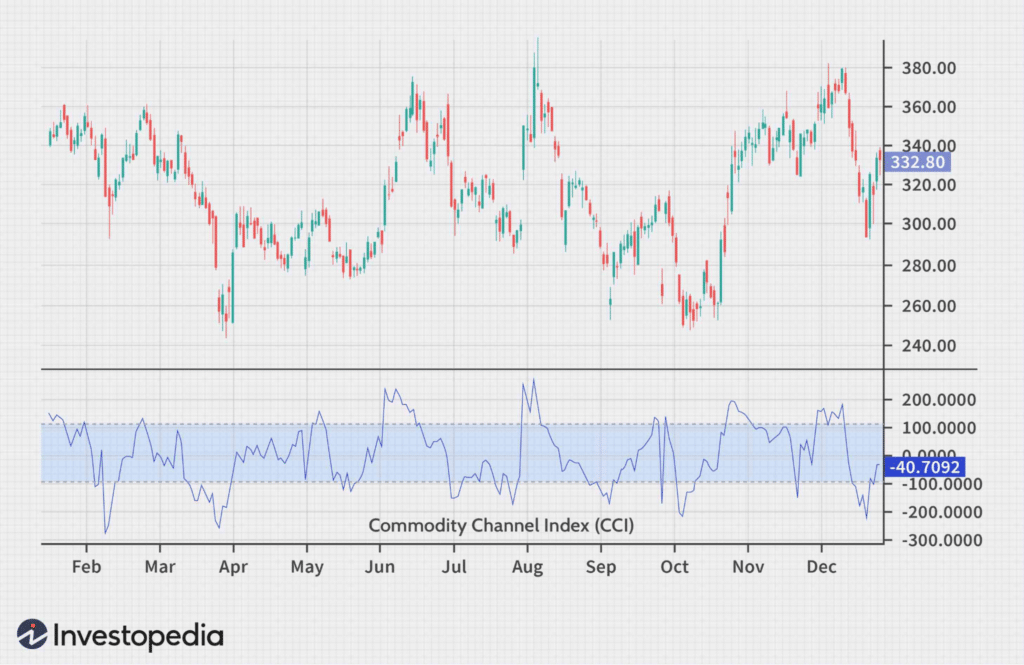
The commodity channel index is a technical indicator from the momentum class that helps traders determine whether an asset is overbought and oversold. It is also known as CCI as the short form. Although hearing its name, some can assume that the indicator is only applicable for commodity trades, which is incorrect. The CCI is effective in trading different kinds of assets as well. It provides benefits in determining the robustness and direction of price trends too.
Moreover, the data that came from the CCI is convenient while traders need to make any trading decisions like figuring out whether they should grab the trade or leave. In essence, the CCI indicator effectively provides trade signals if it functions in a particular manner.
We’ll look at the complete commodity channel trading guide in this subsequent section. After accomplishing the entire section, you’ll be able to find yourself as a master of using the CCI indicator in your strategies.
What is the commodity channel index?
The tool was created to locate the changes in long-term trades, yet market participants adjusted the indicator to utilize it in all periods and markets. Active traders can derive more signals for buying and selling if they trade with multiple time frames.
Typically, CCI is useful for developing the prominent trend in the long-term chart. The indicator is effective in the short term to produce trade signals and isolate pullbacks. The CCI is also robust in figuring out the price trends and calculating potential signals for buy and sell.
Moreover, it is helpful in terms of determining the disparity between the current and the past average price within a particular period. However, the strength or robustness is visible if the index is relatively high. The CCI exceeds the average price means the price of the specific trading instrument is exhausted upside from the current level. On the other hand, if the CCI is below the middle level, it is a sign that bulls are less active in the price, and they may regain momentum at any time.
What is an analysis of the commodity channel indicator?
There is no indicator or strategy without drawbacks; modifying the strategic norms and periods of indication may help better functions. Applying an SL strategy may aid the risk of capital loss even though every method tends to lose trades. Therefore, beforehand executing trades, cross-checking is admirable to measure the profitability of CCI on your preferred time frame and market.
In terms of making it more convenient for traders, most trading platforms keep the options for customizing range. However, the CCI is easy to spot in the lower section of the price chart. It looks like a swinging line in the box with a default range from 100 to -100. Traders can adjust the CCI range as per their trading needs even if the default range is set on 20 periods.

Furthermore, the vital thing to note is that the shorter CCI period indicates volatility, and if the CCI periods get shorter, the volatility gets increased along. The most significant portion of this tool is to find it over or under the 100 and -100 values.
A potential uptrend can appear if the CCI value is more than 100. conversely, if it moves below -100, that is an indication of appearing a downtrend. Besides, the longer CCI period hints that a lower percentage remains outside the 100 to -100 range.
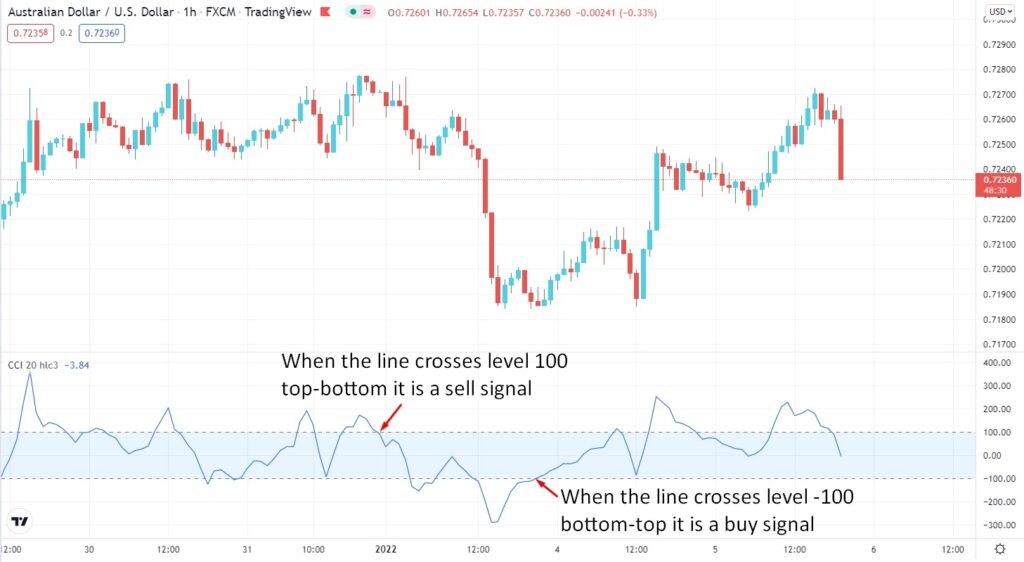
If the CCI line passes from below to +100, converses crossing it in the conversing direction, a sell order may begin. Conversely, the buy signal shows that if the CCI dips under the -100 level, it passes it on the contrary direction.

How to trade using a CCI indicator?
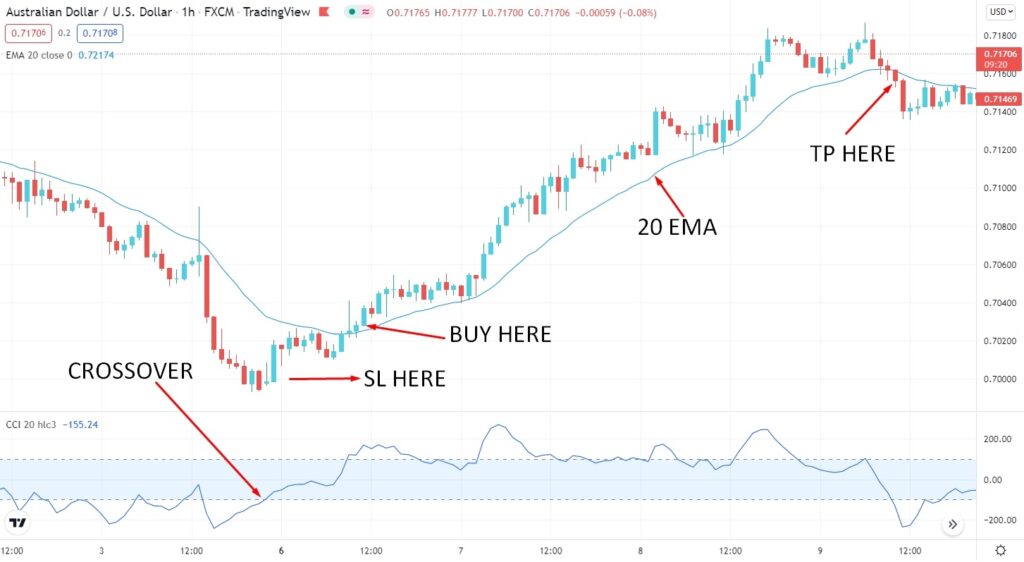
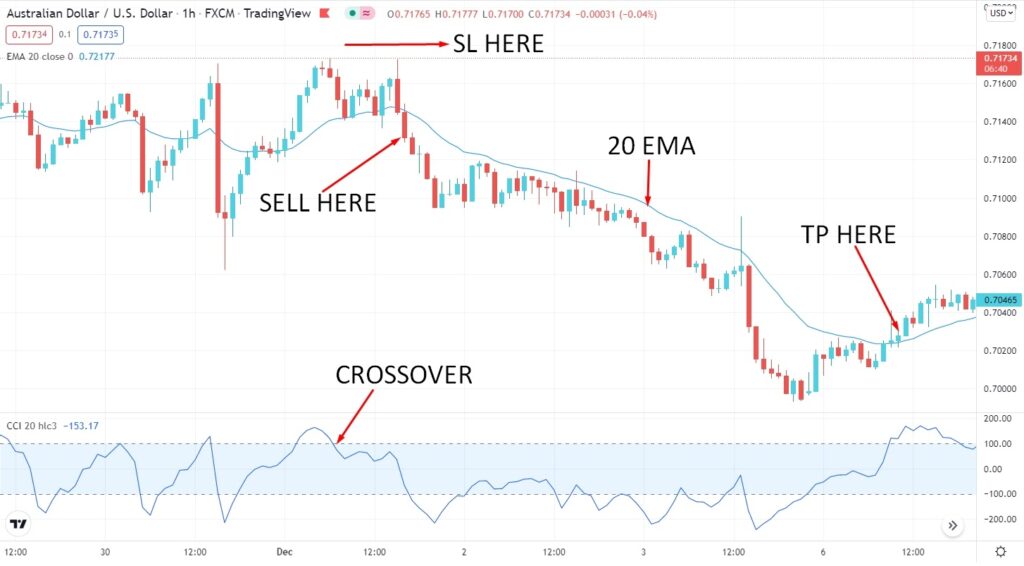
We will use the indicator’s crossover and the dynamic level of 20 EMA for entry and exit points.
Bullish trade setup

Entry
Look for a buy entry when the CCI line crosses the -100 level from bottom to top and the price breaks above the dynamic level of 20 EMA.
Stop loss
Put the SL order below the last swing level with a 10-15 pips buffer.
Take profit
Take the profit by calculating a 1:3 risk/reward ratio. Or else, you can take the profit when the price breaks below the dynamic level of 20 EMA with a bearish candle.
Bearish trade setup

Entry
Look for a sell entry when the CCI line crosses the 100 level from top to bottom and the price breaks below the dynamic level of 20 EMA.
Stop loss
Put the SL order above the last swing level with a 10-15 pips buffer.
Take profit
Take the profit by calculating a 1:3 risk/reward ratio. Or else, you can take the profit when the price breaks above the dynamic level of 20 EMA with a bullish candle.
Pros & cons
| Pros | Cons |
| Very handy in terms of tracing movements in the market. | Provides false signal and causes losing trades. |
| It is effective in several time frames. | Do not incorporate SL in the strategy. |
| Provides the benefit of determining the market entry points for both on a trend and a flat. | It is not a standalone indicator thus requires merging with other indicators. |
Final thoughts
Finally, the CCI is a helpful indicator for calculating recurring buy and sell points. The most beneficial use of the indicator is that traders may figure out the precise time stretch to utilize it combined with a different tool.