The price movement in the financial market creates many technical patterns during price changes of assets. When you can identify and utilize those patterns, you can participate in trades that involve low risk and generate potentially profitable trade ideas. The ‘dead cat bounce’ is a standard technical pattern that you can find on any volatile asset chart.
However, utilizing price formation patterns for successful trading requires a considerable understanding. This article will introduce you to the dead cat bounce pattern besides trading strategies with chart attachments and risk management tips.
What is the dead cat bounce pattern?
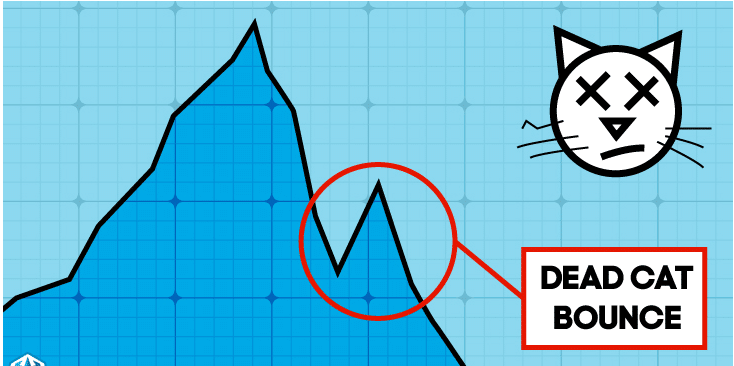
It is a technical pattern that indicates declining asset prices containing a sharp rally. You can consider this pattern to be a continuation of a downtrend that includes a spike toward the upside before resuming to fall. The concept behind naming this pattern is you may throw a can from high with sufficient force; it will bounce before the final fall.
This pattern contains three parts as follows:
Declining phase
It is the initial phase of the pattern in which the asset price has a sharp decline from any peak. This declining phase may break the recent previous low.
The bounce
After creating the new low price bounces on the upside. Investors may think that price falls enough and a buying pressure increases, which pushes the price back and makes a high. This bounce will never cross above the top where the pattern starts formation.
Resuming downtrend
It is the last part that completes the entire formation of the pattern. After reaching the bounce top, the price resumes decline and gets the first low or further downside.

This concept originated in the UK in the 1980s during the financial turbulent. For example, consider a stock floating at its peak near $90. The next day it starts to decline for a valid reason and continues to fall near $60 within three days.
Reaching that level, the investors may consider it is a lower value for the stock, and the price may start to rally toward $75 on the fifth day of the first decline. Making a high near $75, it resumes to fall and may end up near $55. The price movement creates a dead cat bounce pattern on the chart.
How to trade using a dead cat bounce pattern?
This trading pattern allows trading any financial asset such as FX pairs, commodities, stocks, cryptocurrencies, etc. It enables selling opportunities to investors. Stock traders often use this pattern to manage risk on their stakes. When the price bounces, they get rid of the stocks of their possessions and free their capital.
Investors seek to place sell orders near the bounce high. You may be thinking of making money by buying after the first decline, which is somehow risky and not wise. There is no guarantee that the price will bounce toward any level or technique to predict the high of the spike.
You can use this pattern individually or combine the market context with technical tools and indicators such as the Fibonacci retracement tool, support resistance levels, momentum and volume indicators, etc., to determine accurate entry/exit positions. Stock traders often increase profitability and decrease risks through this pattern.

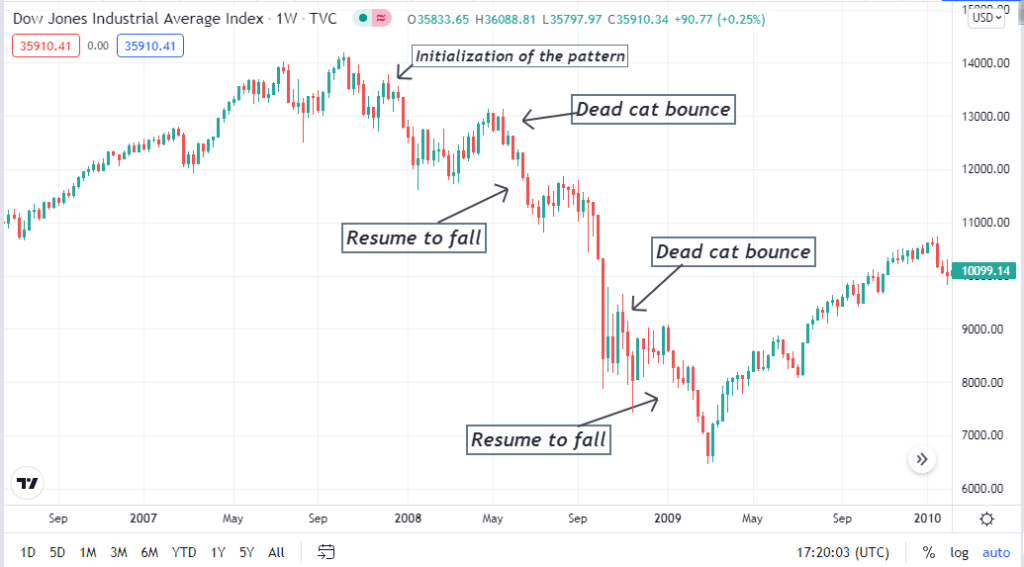
You may know the financial crisis of 2008-2009, which cost millions of Americans to lose their money. The Dow Jones industrial average index fell to the low at the first quarter of 2009, the price bounced back and started to recover due to many government actions. You will mark this pattern on that chart of DJI during that period due to that sharp fall.
Trading strategy using the dead cat bounce pattern
It is a downtrend continuation pattern, so typically, it generates ideas of selling the asset on a particular level. The spike may create a buying opportunity for a certain period, but there is no guarantee that the market context will allow you to have a sure profit from your buy order.
We use support resistance and a popular technical indicator Relative Strength Index (RSI), to identify potential sell position using the dead cat bounce pattern. This trading technique applies to any trading asset with sufficient volatility at any time frame chart. We recommend using charts of H1 or above to avoid fake swing high/lows.
Trade setup
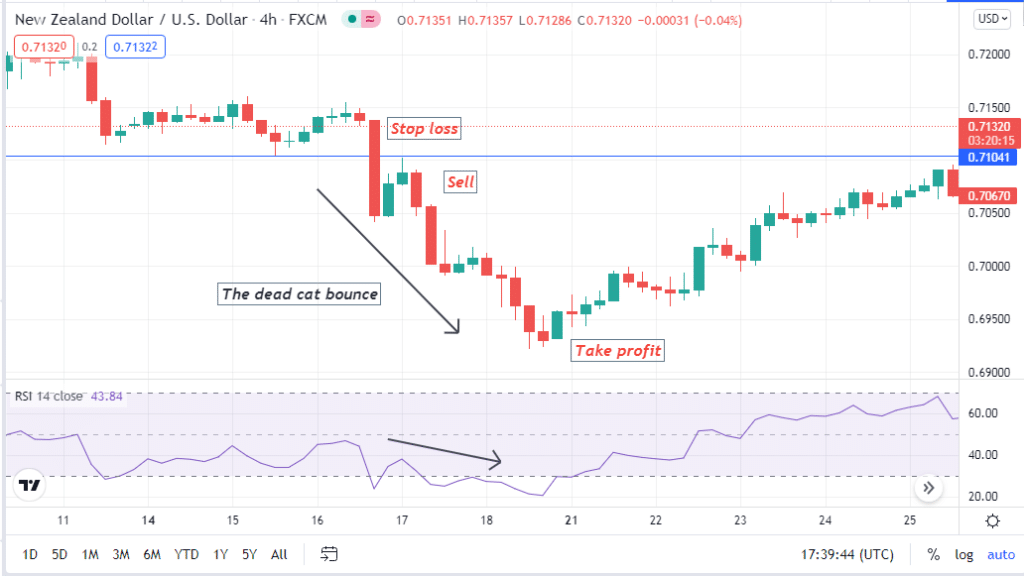
Seek the trading position on your target asset chart that is already declining. We recommend seeking setups on major currency pairs as these pairs have sufficient volatility to create the dead cat bounce pattern. When the price completes the first declining phase and starts to bounce, observe the price movement till it reaches any dynamic support resistance level below the top of this pattern shape.

- The price reaches to near any resistance level and starts to react and resume to decline; check the RSI indicator window.
- The dynamic blue line may get above the bottom (30) line or near the central (50) line due to the bounce in price and head toward the downside.
- Place a sell order with a stop loss above the bounce high and the dynamic resistance line, with a buffer of 10-15pips.
- The initial profit target will be near the first low of this pattern. You can continue the sell order as long as the dynamic blue line of the RSI window stays below the bottom line or near the bottom line.
- Close the sell order when it reaches near any support level or the dynamic blue line of the RSi window is above the bottom (30) line and heading toward the central (50) line.
How to manage the risk?
Risk management tips using the dead cat bounce pattern:
- Often it is confusing to sort the dead cat bounce pattern from regular declining patterns, so confirm the current trend from the upper timeframe charts.
- Don’t make a quick entry; wait till pattern formation and observe the reading of the RSi indicator.
- Use a proper stop loss to keep your capital safe.
- If the pattern fails, don’t make a quick entry. Wait till a proper formation takes place.
- When the price reaches the first low after making entry, you can shift your stop loss at or 2/3pips below breakeven as part of risk management.
Final thought
Finally, these are the primary pieces of info about the dead cat bounce pattern. We hope you find this article quite educational and informative. We suggest avoiding trading with this strategy during any major economic event such as GDP, interest rate decision, CPI, etc., news release of the target asset.