It is an irregular reversal chart pattern that resembles a Head and Shoulders (H&S) at the top or the bottom. The H&S is easy to understand and trade, but a Diamond pattern is challenging to point out on the chart as it creates uneven highs and lows.
Not every trader can afford to wait, for example, two or three months until the signal is fully formed. But in this case, there are some positive aspects: almost always, the technical figure works out the signal, and this development can bring a very tangible profit.
The premier thing to trade any reversal pattern is the opportunity to obtain the best risk: reward on the trade setup. Diamond pattern here will do the work; the sooner you spot the reversal, the sooner you expect the reward.
It is not easy to trade like most other technical figures, and it needs you to train your eyes to look for it. Especially when to enter and where to top put your TP and SL.
Let’s learn how to trade it.
Winning strategies to trade
It is a price pattern that forms at the bottom or the top of the trading chart with a strong upwards or downwards movement, followed by a flattening sideways trend over a prolonged period forming a Diamond.
The best trading setup for any technical trader is detecting and trading reversals as it is the most profitable trading opportunity. And luckily, the Diamond pattern is a reversal trading technical figure.
Types of the pattern
There are two types:
- Top
- Bottom
The bullish
It is formed at the end of an ongoing bearish trend. It occurs at the bottom of the trading chart and signifies that the market could soon reverse from bearish to bullish. The price makes the pattern by forming a series of highs and lows while being in a consolidation state.
The bearish
It is formed at the end of an ongoing bullish trend. It occurs at the top of the trading chart and signifies that the market could soon reverse from bullish to bearish.
How to trade?
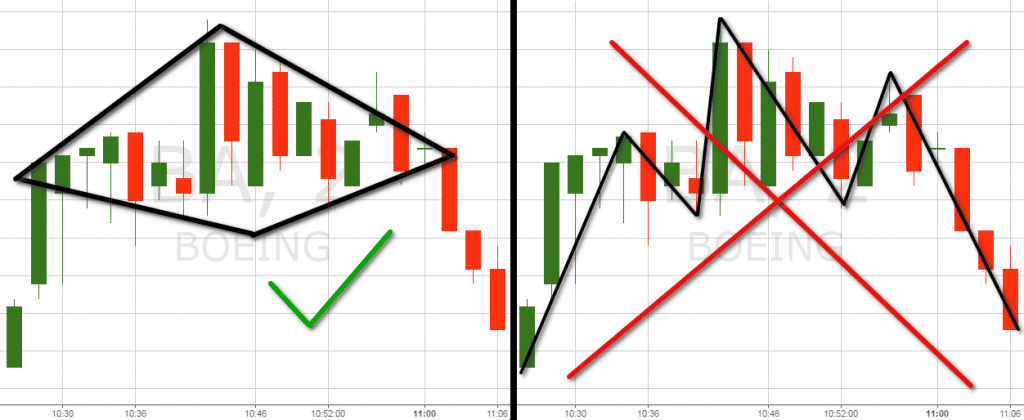
First you need to identify the technical figure. It is an off-center H&S pattern with four sides while price oscillates in between.
You will draw trendlines from four sides to complete it on the chart. You need to draw two trendlines from starting point outward to join the wave’s swing highs and swing lows. Furthermore, the other two lines from the maximum high and maximum low to an inward side join the swing highs and swing lows until both lines intersect.
Once you draw the pattern on the chart, you will wait for the price to break it and keep in mind to avoid catching up with a false breakout.
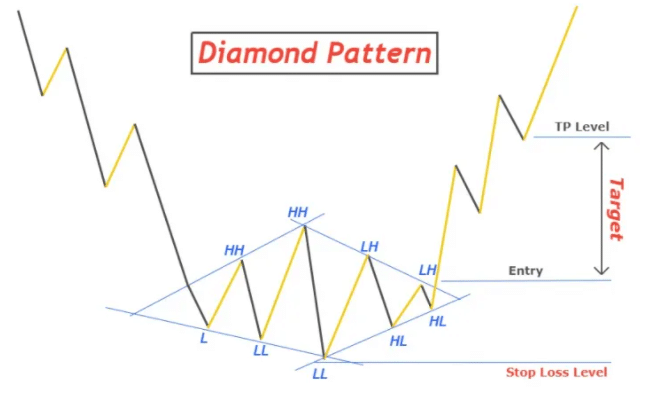
Bullish trade setup
In the above chart, the market was seen following a downtrend. Then the market started making a bull Diamond pattern at the bottom of the chart. After the technical figure’s break was successful, the market started moving up.
The following confirmation is required when using this technical figure:
- Oversold condition
- It forms after a long bearish trend
- Break out with strong momentum upwards
In the above chart, we can see the price was following an uptrend until a top is formed on the apex of the chart. After the break of the pattern market came down crashing and started forming a downtrend.
Entry
For a low-risk entry, wait for a price breakout on the right side top trendline. The breakout should be a significantly larger candlestick which shows momentum, and buyers are pushing the price upward.
Stop-loss
The SL target can be below the low of the pattern.
Take profit
It is determined based on the height between the lowest point of the Diamond and the high. If the distance is 100 pips, you can set your TP level 100 pips away from the entry point.
Bearish trade setup
It forms after an extended uptrend. This is a sign that the market will reverse downwards.
The following confirmation is required when using it
- Overbought condition
- Forms after a long bullish trend
- Break out with strong momentum downwards
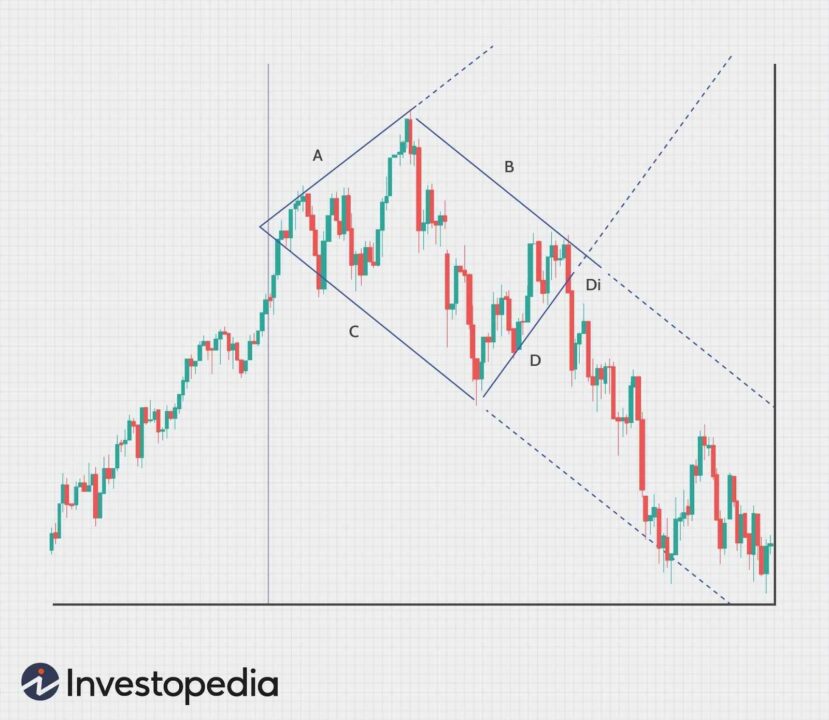
In the above chart we can see the price was following an uptrend until a Diamond top is formed on the top of the chart. After the break of the pattern market came down crashing and started forming a downtrend.
Entry
The entry point for this pattern is after a strong breakout occurred below the bottom right trendline. A long bearish candle represents the breakout.
Stop-loss
You can place your SL above the high of the technical figure.
Take profit
The target for TP is the distance between the high of the pattern and the lowest point. Therefore, if the distance is 50 pips, the profit level is taken 50 pips from the entry point.
Is the strategy profitable?
This is a significant reversal price pattern. It belongs to those few that are less known and used by the market participants. But we know rare works most option. This technical figure is tough to find on the chat and it can be used in any financial asset but works best in FX trading. Just keep in mind to avoid false signals and not forcefully draw the pattern on the chart because you think it is a Diamond.
Final thoughts
In general, the figure is considered complex, but after a trader has traded it a couple of times, everything will be stored in his memory, and then the eye will notice such sequences of movements.
The main reason for losing money is ignoring recommendations for entry. Opening an order too early often leads to losses, which in the context of sharp movements and a change in direction can provoke attempts to quickly “recoup,” leading to even more significant losses.