The stock market is a rapidly expanding sphere with trillions of market capitalization of numerous stocks. Therefore, the economic and financial potential of stock shares encourages investors to set foot in this arena.
Investors actively strive to adopt the most profitable strategy for their investment decisions. Success in stock exchange investment is not a pre-defined factor; therefore, investors seek analysis methods to maximize their gains.
For understanding the actual value and prospects of a stock, businesses and individuals use detailed assessment and comparison methods.
Further, as in this article, we will unfold the most beneficial fundamental analysis tools and strategies for picking up the most valuable stocks.
What is fundamental analysis for?
It estimates the original value of an entity reflective of its future trajectory. It is a quantitative evaluation method that considers various factors, including a company’s profit and loss statement, cash flows, revenue, quarterly earnings, and comparison of share prices.
Investors can determine whether specific stocks are undervalued or overvalued through an in-depth analysis before making financial investments.
The difference in the present and intrinsic value of shares forecasts a rocketing or plunging price. Thus, the careful consideration of all components creates a promising investment opportunity in the stock market.
There are also some tools that you can use while trading stocks using fundamental analysis, and we have listed them below.
What are the most widely used tools for fundamental analysis?
You need to utilize various tools for gauging the financial health and future value of stocks. We have discussed some of them below.
Company financials
A company’s revenue or earnings can not solely estimate the value of stocks in the market. You need to consider fundamental ratio tools for drawing a detailed framework of different stocks and their potential.
- Earnings per share (EPS)
EPS is evaluated by dividing the net profit by the stock shares that a company has issued, determining each share’s profit. This tool indicates the revenue or gains and overall value of a business.
Shareholders can also compare the EPS with current stock prices to approximate the profits/gains of a company and future price expectations.
- Return on equity (ROE)
Return on equity estimates a company’s profitability or capacity to generate profits on the investor’s shares. You can calculate it by dividing the net income by shareholders’ equity. Companies with average or slightly above average ROE are considered suitable for investments.
A high ROE percentage usually indicates significant debts and negative income of a corporation. Hence, investors should compare ROE with similar sector entities to avoid false indications for investments.
- Price to earnings (P/E) ratio
It is an excellent indicator to distinguish between undervalued and overvalued stocks. P/E ratio measures a company’s stock price concerning earnings per share. High and low P/E both have implications on stock prices.
Investors must carefully gauge this ratio for devising accurate information and data. It is best to use this tool comparatively instead of considering the absolute values for maximizing its usefulness.
- Price to sales (P/S) ratio
It is an effective tool to estimate the growth potential of stocks. You can determine it by an institution’s market capitalization and its revenue over the past year. A low P/S ratio with no debt usually reflects a stock’s undervaluation and serves as a buying indicator for investors.
However, considering other corresponding factors like sector type, accumulated deficit, and profit range is also essential to avoid false signals.
- Dividend yield & payout ratio
While interpreting a dividend yield and payout ratio, it is essential to know the age/maturity of a company beforehand. This valuation method tells the number of dividends distributed to the shareholders relative to the company’s net income.
A low payout ratio represents the corporate’s plans to reinvest and utilize the remaining capital for future growth plans.
On the other hand, some companies pay out their entire income as dividends. Therefore, investors should carefully search for moderate payout and dividend ratios for dodging any bad business situations.
Financial news

Investors keep track of the various financial news releases for staying ahead in the financial markets. Stock prices undergo rapid swings concerning good or bad news announcements and altering supply and demand. Government economic reports, the company’s financial data release, and earnings reports are standard news releases valid for investors.
Instead of buying or selling stocks after the news release, long-term investors anticipate the news events and take action before the financial releases.
News releases are synonymous with a flipping coin as the same announcement can impact various industries/sectors differently. In addition, investors need to account for unexpected and sudden news events that can wreak havoc in the stock markets.
Stock compare
Financial markets represent constant competition between rival companies and sectors. For remaining successful in this sphere, it is essential to understand the standing of an entity as compared to its peers. Consideration of separate indicators or tools cannot provide factual information about a sector’s absolute value and health.


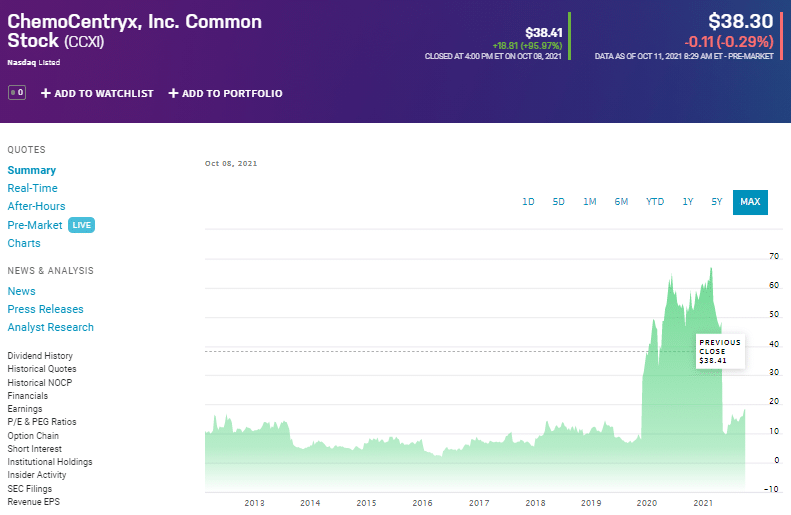
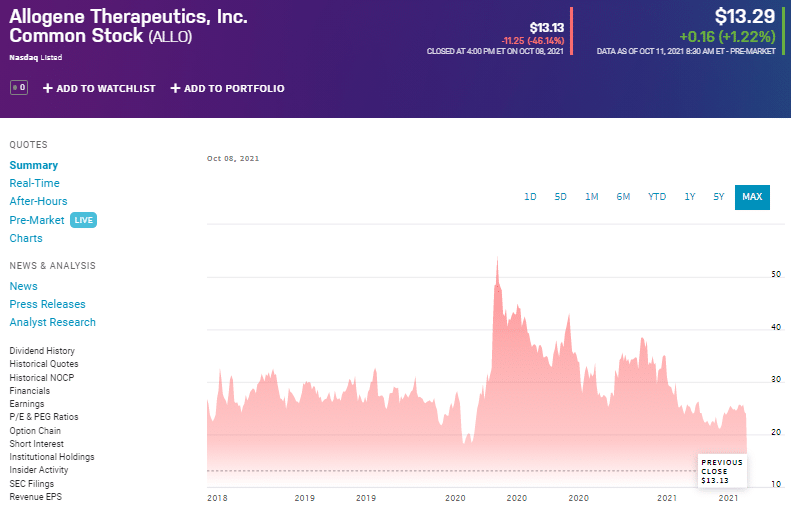
| CCXI | ALLO |
| ChemoCentryx (CCXI) is a biopharmaceutical company focused on discovering, developing, and commercializing orally administered therapeutics to treat autoimmune diseases, inflammatory disorders, and cancer, primarily focused on orphan and rare diseases. | Allogene Therapeutics (ALLO) is a clinical-stage biotechnology company leading the development of allogeneic chimeric antigen receptor T cell (AlloCAR T™) therapies for cancer. |
On the other hand, stock comparison tools enable traders to look at the bigger picture of global financial conditions. Moreover, attentive research and analysis of metrics between different companies aid the investors in their financial decisions. As a result, choosing the right stock becomes much easier with comparison practices.
Economic calendar

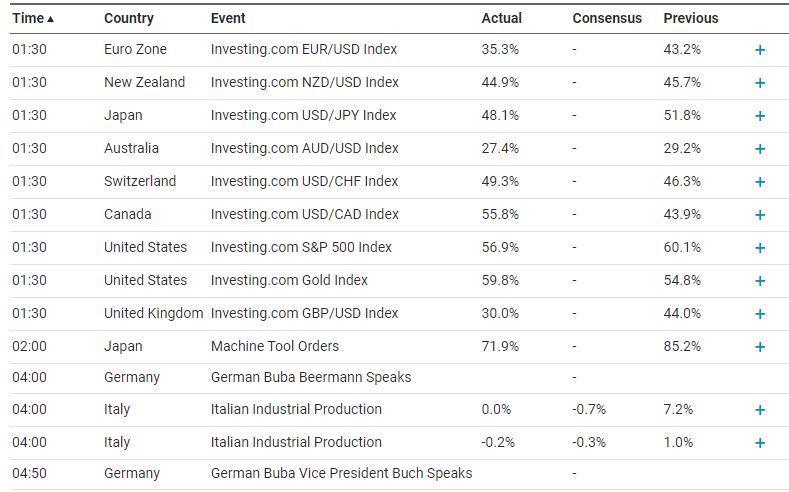
The economic calendar presents a schedule of significant data releases or announcements of given countries that can radically move the stock markets.
Investors decide their approach to financial markets by looking at the economic calendar and researching the data related to impending news/reports.
The common events include weekly or monthly employment claims, interest rate/GDP reports, and economic surveys. Traders or investors can squeeze out immense profits by careful assessment of the economic calendar.
But high impact releases and high volatility of the market can also work against your anticipation. Therefore, you should never miss out on managing your risks and tolerance before entering the market.
Real-time heat lists
Investors can benefit from the real-time data lists from worldwide financial markets. By looking at these real-time heat lists, they can assess various companies’ live performance of stocks. In addition, investors can quickly pick stocks from the companies that represent gaining impetus through the live data projection.
Numerous financial websites and mobile applications present the data figures corresponding to losing or winning stocks in different colors.
Pros & cons
| Pros | Cons |
| Reliable data and prediction The fundamental stock analysis presents reliable financial information due to the utilization of in-depth indicators and tools. | Complicated analysis Fundamental analysis requires extensive research and assessment of numerous macro and microeconomic factors, making it complex. |
| Safe long-term investment Investors can rest easy with expectations of long-term gains. | Difficult/impossible data acquirement An average investor or trader cannot access confidential data reports. |
| High winning probability As this analysis involves extensive research to evaluate the intrinsic value of stocks, you will face less monetary risk. | Time-consuming This analysis is hugely time-consuming as you need to consider many factors, indicators, tools and draw objective predictions. |
Final thoughts
Stock markets are a manifestation of investors’ and traders’ interest to engage in this financial world. The falling and rising prices of stock shares represent the impact of company policies, financial prosperity, and news events on shareholders’ sentiments.
Effective utilization of fundamental analysis tools can accentuate your chances of picking out a valuable stock from a large pool. Hence, we can say that long-term shareholding after careful research and analysis can lead to enormous gains.