You may have probably heard about the trendlines — one of the basic concepts of technical analysis, which presents you with a clear picture of how and when to enter the trade.
The good thing about these lines is that you can use them in any time frame. So whether you are a scalper or a swing trader, you can use them for going long or short.
This guide will discuss how these lines work, their importance for swing trading, and how to combine swing trading with trendlines.
Trendlines explained
They are sloping lines that depict where the price is moving and present you with an idea of how the market is behaving in a given period.
- When the price surges, there’s an upward trendline.
- When the price falls, you draw a trendline pointing downwards.

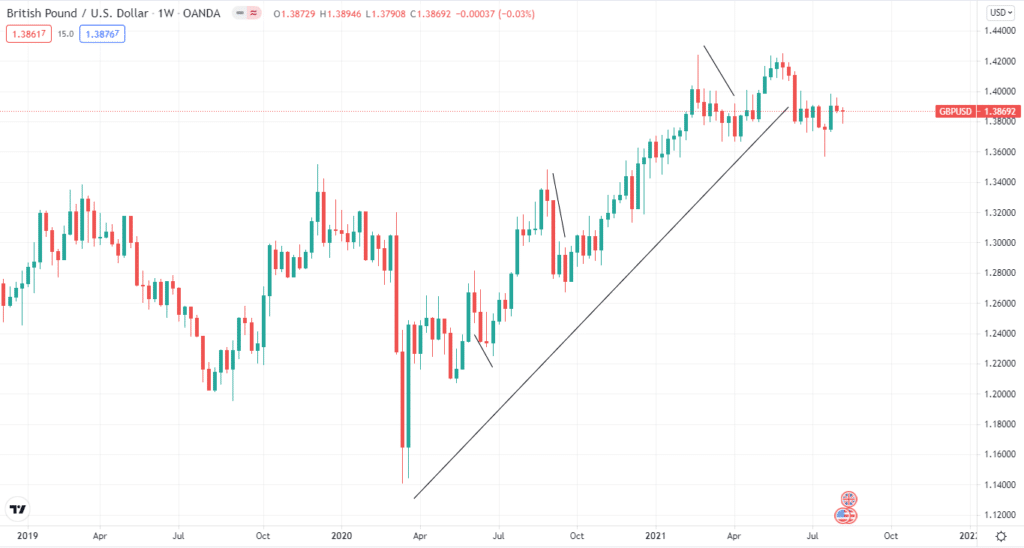
As you can see on the chart, these lines give us various price structures to give us an idea of what positions we should be taking. The question is how to draw them on the chart. Unfortunately, there are no specific details for their drawing, as two traders may end up with different trend lines.
Some traders apply the closing prices to draw a trendline; some combine high, low, open and close to illustrating it. It is entirely up to you to decide how to take the price for drawing a trendline.
If the price touches this line frequently, it gives better trading opportunities.
- Upward lines serve as support when an FX pair or any other asset is heading upward.
- Upward lines pop up mostly below the price and connect a succession of period lows.
On the other hand, a downward trendline links a series of closing prices or period highs that serve as resistance.
The problem with a trendline is that you must alter it frequently to limit market noise. This is because the price can move in the opposite direction, and your trendline may become unsuitable when you draw it.
A key point to add here is changing a trendline does not indicate changing of trend. So if the price is making higher highs and lower lows during an uptrend, whether you tweak the trendline, it will continue to be in an uptrend. Within a single trend, you may find yourself adjusting your trend lines several times.
Let’s explain this on the chart.
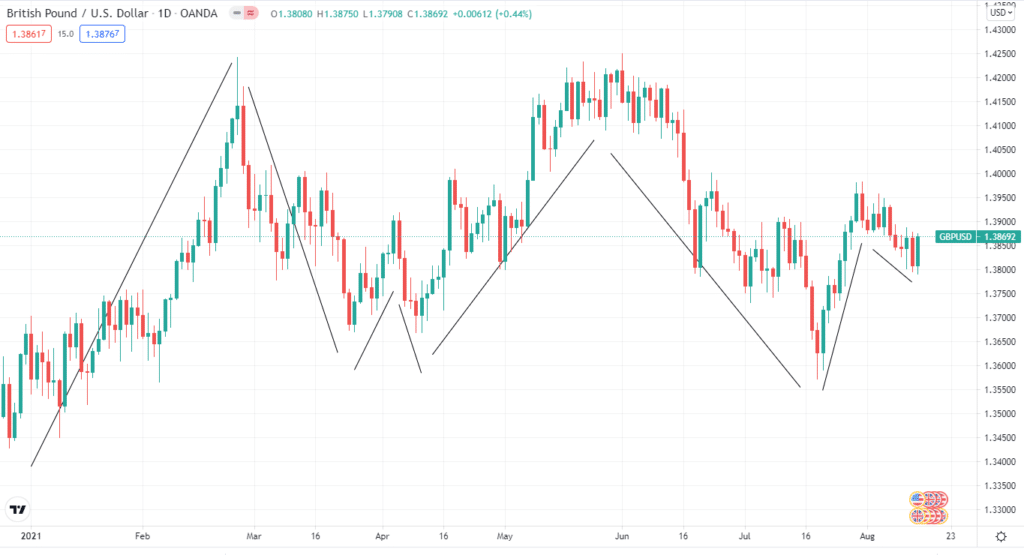
On the chart below, you can see that while the overall trend is up, there are three occasions where the price is making lower lows. Therefore, you need to adjust the line according to the specific situation.

Why use trendlines with swing trading?
Now that you understand the concept let’s find out if trendlines are an excellent option for swing trading — a longer form of trading, which requires you to hold positions for days or weeks. This type of trader finds opportunities from market swings. The idea is to find an FX pair or other asset that is moving in a particular direction.
Now, trendlines show us whether the price is moving up or down, and swing traders want to profit in one direction. So, swing trading and trendlines are a perfect combo. Such lines can also act as support and resistance levels. Therefore, it presents swing traders with several retracements.
When the price disrupts the trendline, there’s a possibility of a trend reversal. However, in a trending market, most breakouts are false signals.
How to use the trendline for swing trading?
In an upward trend, the price increases and falls. If the price is somewhat lower than the trend, and the highs and lows are higher, the upward trend does not stop. This acts as an upward trend, and your trend lines must be adjusted accordingly.
Conversely, in a downtrend, the price makes lower lows and lower highs. Therefore, if the price is higher than the line and lower and lower, it decreases, indicating a downward trend. So all you have to do now is change your trendline.
There are times when you’ll need to draw one or more trendlines. To plot several trendlines, you need to seek every possible point utilized for the trendline. The smaller trends within the general trend are reflected here.
When a minor movement meets the overall upward trend, buying opportunities may develop. Conversely, selling possibilities arise in a downward direction when the minor trend meets the downward trend.
Trendline swing trading strategy
As we mentioned, these lines can work at any time, but as we are talking about swing trading, you need to use a longer time frame. For example, you can use a daily or weekly chart for swing trading.
Trendline buy strategy
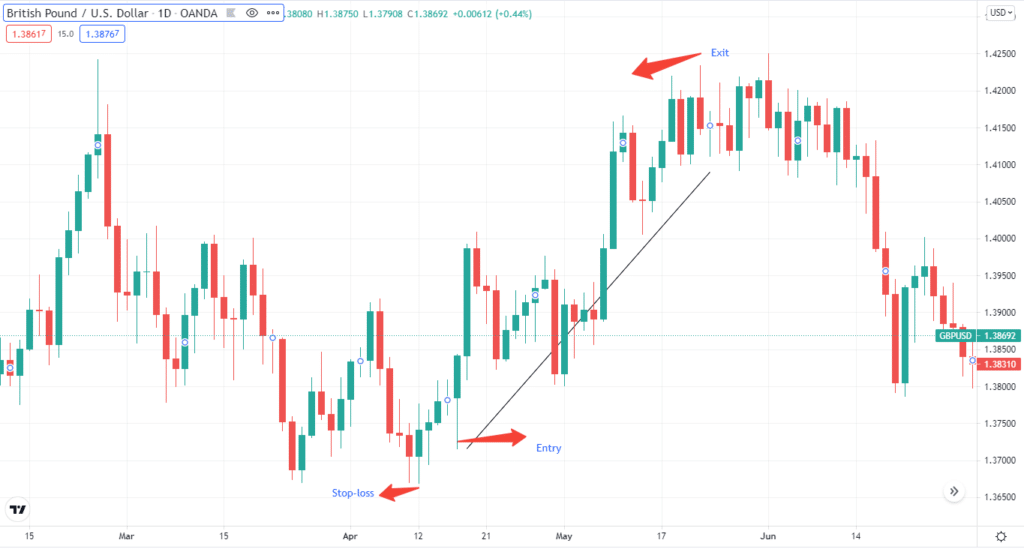
- Locate an uptrend and draw a trendline
- Wait for the price action to turn bullish before entering
- Enter the trade after the confirmation of an uptrend
- Place a stop-loss near the recent low from the entry point
- Exit the trade when the trend reverses

Trendline sell strategy
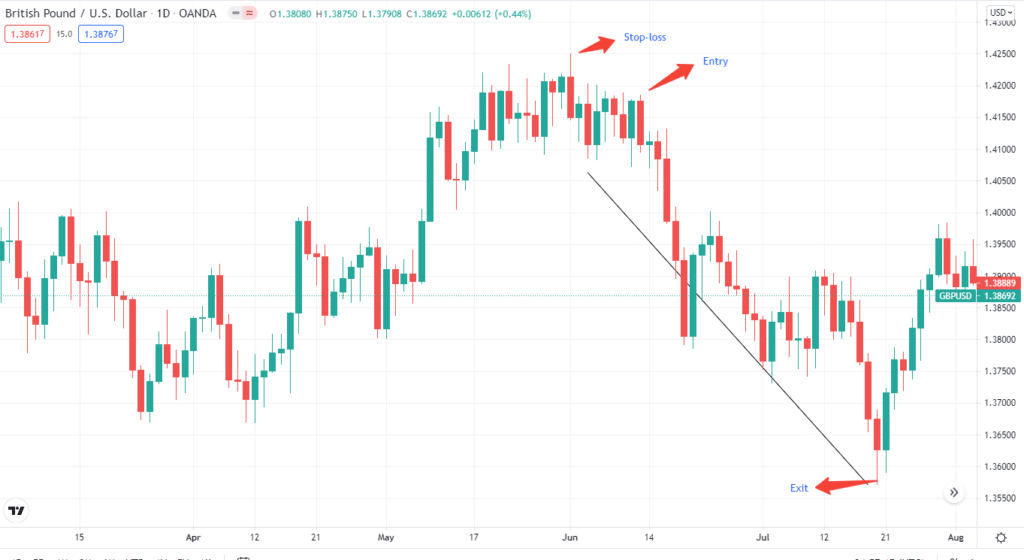
- Locate a downtrend and draw a trendline
- Wait for the price action to turn bearish before entering
- Enter the trade after the confirmation of a downtrend
- Place a stop-loss near the recent high from the entry point
- Exit the trade when the trend reverses

Key takeaways
- These lines act as a guide and not a pattern where you can jump in right away. They show where the price is heading next. You can expect the price to move in a zigzag within the trendline.
- Price action is key, and you should combine it with trendlines. In an uptrend, watch for higher highs and lower lows. The trend can get bothered if a lower high or lower low happens. In a downtrend, look for lower lows and lower highs. Again, the downtrend can get disturbed if a higher low or higher high occurs.
- Redrawing a trendline is a common occurrence, and you need to adjust your ines according to current market conditions.
- When swing trading trendlines, draw a trendline on longer timeframes like daily or weekly.
Final thoughts
Swing traders want to capture price swings, and a trendline can help them in this process. First, however, you need to fine-tune a trendline, as the price can change its path.