Multiple time frame analysis helps you look into the market from all the aspects — scalping, day trading, swing, and positional.
Rember, while trading with multiple time frames, you may use any strategy, tool, or technique. The rules do not bind it. It’s free and open to use in any form.
Let’s look at how to make the best use of multiple time frames in your trading style.
What is the chart time frame?
Charts in any form of technical trading are the graphical representation of price movement concerning time. A time frame is an interval that creates a new price bar and represents the price movement in different periods.
For example, in a 1-hour time frame, a new candle is formed every one hour. All the price movement is denoted within this 1-hour.
There are different time frames available for you to utilize, ranging from one min to yearly. But the most commonly used time frames are:
- 4-hour
- Daily
- Weekly
- Monthly
Here you can use the different time frames and trade in the market.
Why is it important to use multiple time frames?
You can use time frames individually, but to make the best use of them, you may choose to trade using multiple time frames.
Multiple time frame analysis is a technical style. Here you use different time frames to get an idea of a trade setup. These trading setups are more accurate than someone using just a dedicated time frame.
The reason to say so is by using multiple time frames. Thus, you tend to know what is happening in all the time frames, whether the price is approaching a support or resistance zone in a higher time frame or multiple rejections on a lower time frame.
How to use different time frames to make decisions?
Every time frame has its significance. Using it entirely depends on your trading style. We call it this way — any time frame less than 30-min is considered a lower time frame. However, a time frame greater than 1-hour is a higher time frame.
Typically you will use the lower time frame 1-min, 5-min, 10-min, and 15-min for scalping. This is because you will be in the trade for very little time and need to know what’s happening in lower time frames.
In day trading, you will use a daily, 4-hour, and 30-min time frame.
Thus, you will use:
- The daily time frame for market trend analysis
- The 4-hour time frame for price action patterns
- The 1-hour for trading signal
- Candlestick rejection and a lower time frame, say 30-min or 15-mins for trade setups and entry
You will use a higher time frame in swing and positional trading because you will be in the trade for a longer duration. The best way to do it is by using a weekly time frame for trend analysis, daily for major support and resistance zones, 4-hour for price patterns and trading signals.
To better understand all these, we will take an example of day trading and then see how to use the multiple trade frame for technical analysis.
Bullish setup
Below is an example of a bullish setup using multiple time frames. We have taken the USD/JPY currency pair as an example.
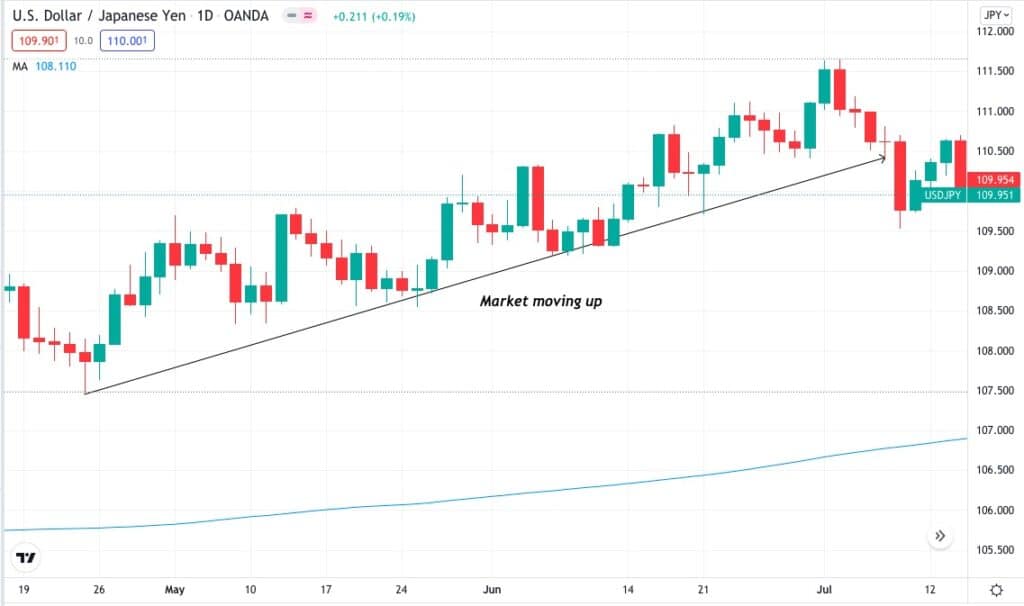
Above is a daily time frame chart showing the market trend. The market here is moving upwards, meaning you should look for only buying signals.
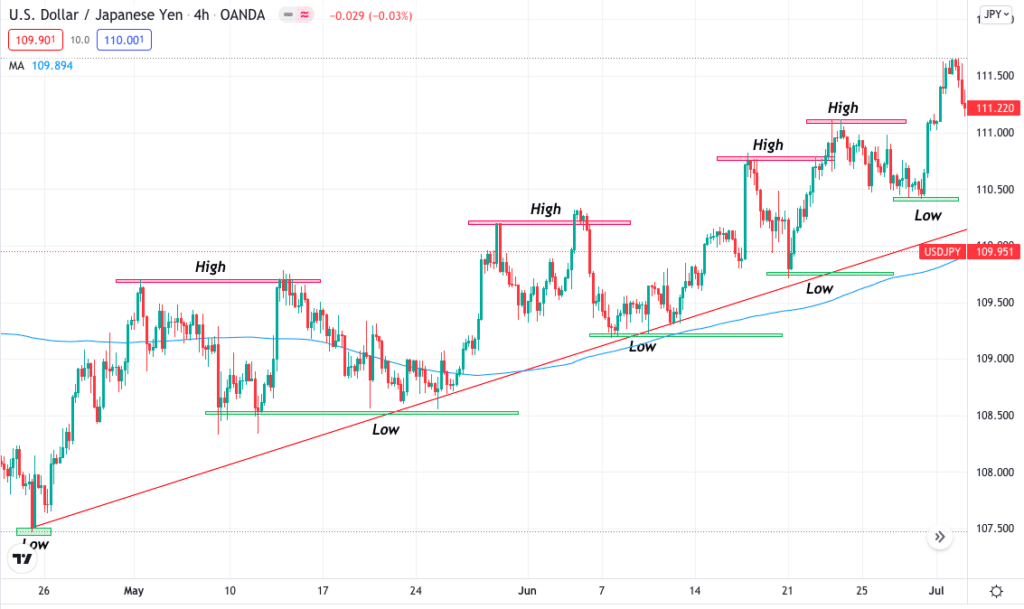
Moving to a 4-hour time frame, you can see the market making higher highs and higher lows, confirming the trend. The price made a double bottom near support that is a bullish price action pattern. Also, the price formed the pattern near the 200 moving average.
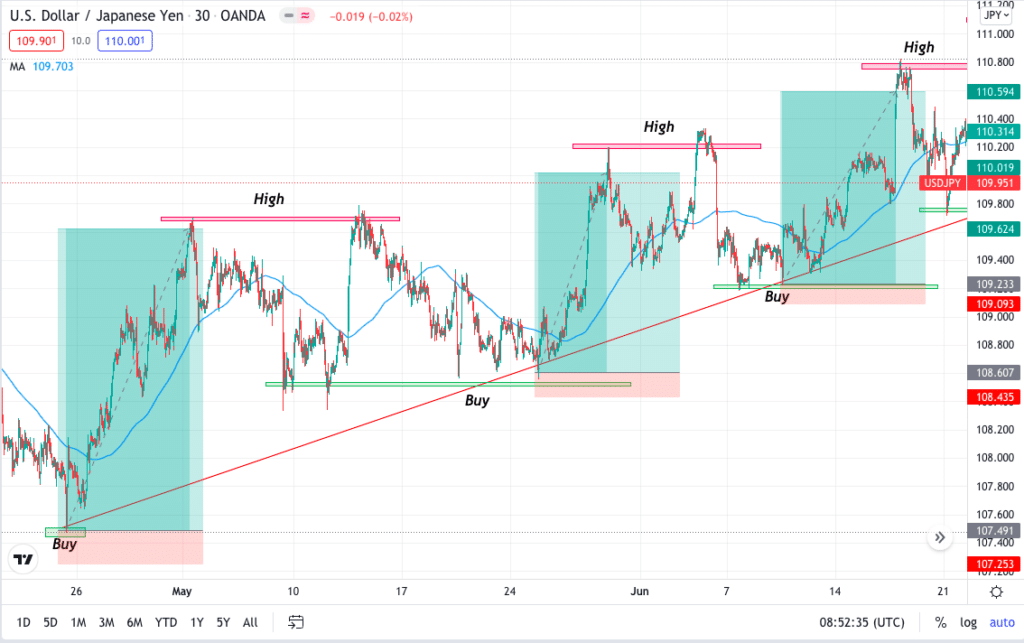
In a 30 min time frame, you will enter the trade after looking for price breaking the highs. You will always look for trading setups near the resistance or the bullish trendline. More rejections from the buyers mean the market wants to move up.
Where to enter?
You will enter the trade when you see multiple candle rejections near support or trendline on a lower time frame with continuous candles like Dragonfly Doji.
Where to put the stop-loss?
Stop loss will be 8-10 pips away from your entry.
Where to take profit?
Your take profit placement depends on you but typically can be 1:3 r:r or 10-20 pips before a previous swing high or resistance.
Bearish setup
Below is an example of a bearish setup using multiple time frames. We have taken the USD/JPY currency pair as an example.
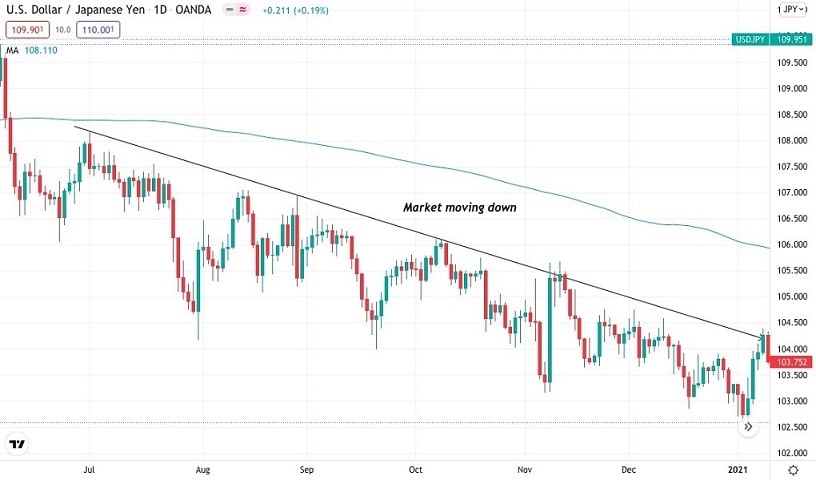
In the above chart on the daily time frame, you can see the market here is moving downwards, meaning you should look for only selling signals.
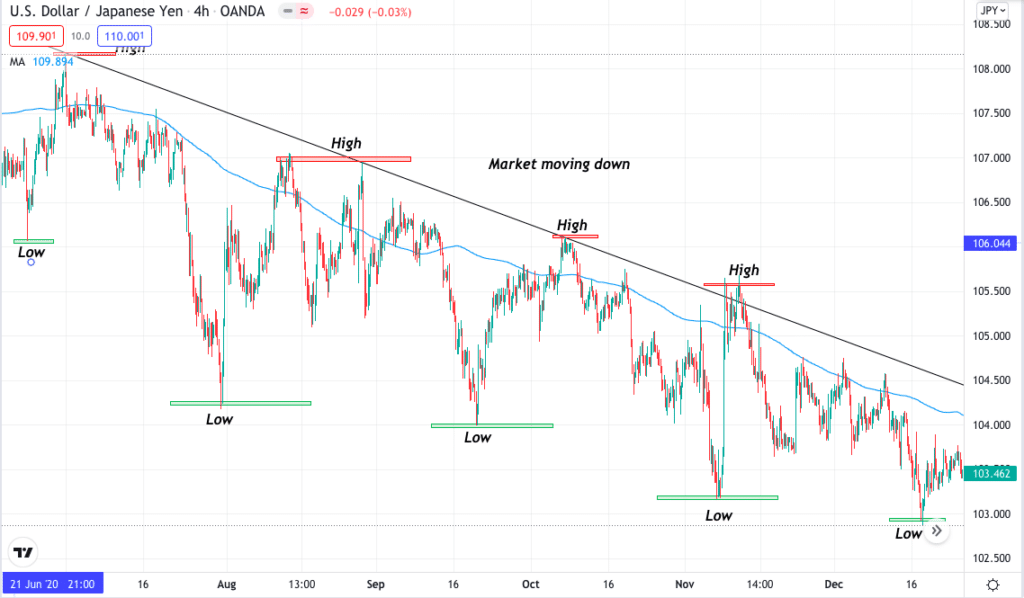
In the 4-hour time frame, you can see the market making lower highs and lower lows, confirming the trend. The price made a double top near bearish trendline that is a bearish price action pattern.
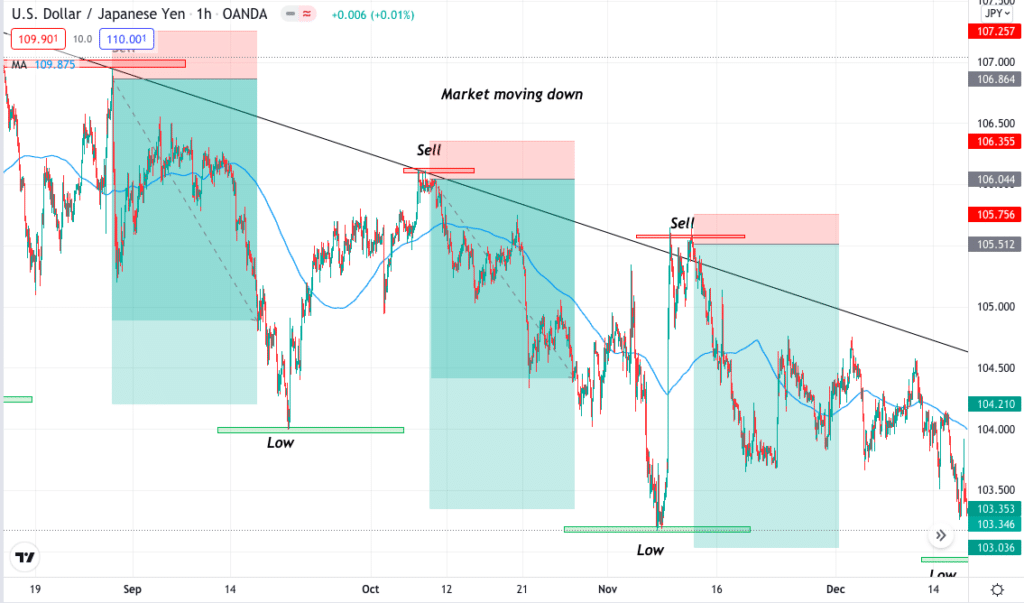
You will enter the trade in a 1-hour time frame after looking for a price breaking the lows. You will always look for trading setups near the support or the bearish trendline. More rejections from the sellers mean the market wants to move down.
Where to enter?
You will enter the trade when you see multiple candle rejections near resistance or trendline on a lower time frame with continuous candles like Gravestone Doji.
Where to put the stop-loss?
Stop loss will be 8-10 pips away from your entry.
Where to take profit?
Your take profit placement depends on you but typically can be 1:3 r:r or 10-20 pips before a previous swing low or support.
Pros & cons
| Pros | Cons |
| Monitor ins and out You get to know every movement that is happening in all the time frames. | It takes a long time It takes more time to analyze, also resulting in delayed entry. |
| Better trade confirmation You get better trading entries with multiple time frame analyses. | Not of much use for long trades Not of much use for positional trading or investing. |
| Can use any strategy You can use indicators, price actions, or any strategy or tool to trade. | Overwhelming information Too much information is harmful. You will sometimes get confused, especially if you are a beginner. |
Final thoughts
Multiple time frames can intensively increase your chances of winning a trade. The best thing about using it is that you tend to get all the price movement information in different time frames. This, in terms, helps you be prepared if any support or resistance is near, understanding the trend better, and letting your trade run for higher profits if every time frame shows the same trend.
Lower time frames have a lot of noise and disturbance, so you must choose your time frame accordingly.