Investors and traders ardently keep looking for ways to maximize their benefits and earnings. They utilize two primary analysis techniques, i.e., fundamental and technical analysis, to decide investments and buy or sell stocks, assets, and commodities.
Both analyses techniques provide diverse assessments to consider before entering the market. Technical analysis will help in gradually increasing your portfolio while fundamentals can give quick profits.
But are you wondering which approach can generate you maximum profits and gains?
Dive into the article as today’s we will unfold each technique’s divergent advantages and limitations and how they can reward you as a trader or an investor.
What is technical analysis?
Technical analysis involves studying previous chart patterns and price movements of financial markets to predict future price action. A technical analyst uses different technical indicators to identify high probability scenarios of price activity. In addition, this analysis method can pinpoint price fluctuations in different market situations and formulate a profitable trading strategy.
The most basic indicators to start your technical analysis are the support and resistance levels of the previous price. Similarly, oscillators and moving averages are also common indicators necessary for studying market volume and price movement.
Therefore, we can say that technical analysis involves:
- Using many tools for marking trends.
- Ranging prices.
- Possible continuation or reversal scenarios.
What is fundamental analysis?
It is a comprehensive analysis technique that involves the consideration of the true value of the stock, currency, or commodity and various economic factors. A fundamental analyst assesses the best investment opportunities by considering a company’s quarterly earnings, free cash flow, revenue, and overall value.
During this analysis, you identify the bigger picture of a country’s economy by evaluating its GDP levels, inflation, and employment rates. These varied factors help in predicting the future value and direction of specific sectors. Determining these broad aspects makes it easier to invest in stocks with better intrinsic worth and prospects.
Technical vs fundamental analysis: which is better for investors?

Technical and fundamental analysis both have their benefits depending on the situation. The selection of a technique mainly depends on the duration of your investment and risk capacity. As a general rule, long-term investors utilize fundamental analysis to profit from a gradual price growth over a long period. In addition, there are fewer chances of potential losses if you go for extensive research about your relevant stock/commodity before buying.
Whereas short-term investors who want to grab quick profits utilize technical assessment methods. They benefit from the price movements in a day or two by selling and buying at different levels. The chances of loss are high for technical analyst traders and investors. But with it comes the opportunity of gaining enormous profits in a short period.
It is an excellent strategy to combine both techniques for maximizing your gains. Technical analysis indicators can provide appropriate entry points to you. And you can enhance the probability of profits with the addition of fundamental analysis.
Technical vs fundamental analysis: which is better for traders?
Most experienced traders follow a specific trading style and analysis. Traders often make use of technical indicators and price action to analyze the market. They combine fundamentals with their technical analysis to confirm their decisions.
However, some base their market assumptions on fundamentals mainly, and then they use price action to execute traders.
When it comes to trading, the fundamentals at play are usually major economic news that creates above normal market volatility since these events create the liquidity from which traders can profit.
There is no specific rule, and it depends mainly on your trading style, but the majority prefer technical analysis and taking fundamentals under consideration to minimize risk.
Best trading strategy, which is based on fundamental analysis
Forex fundamentals like significant news events impact the financial markets and generate high volatility in the price movement. The scheduled news events allow you to draft your trading strategy beforehand to enhance the profits. Employment data, core GDP, FOMC interest rate, inflation, and retail sales are recurrent news events that provide fundamental data about the economic conditions.
Below are the bullish and bearish trading setups to help you understand how to trade the market using fundamental analysis.
Bullish setup

Where to enter?
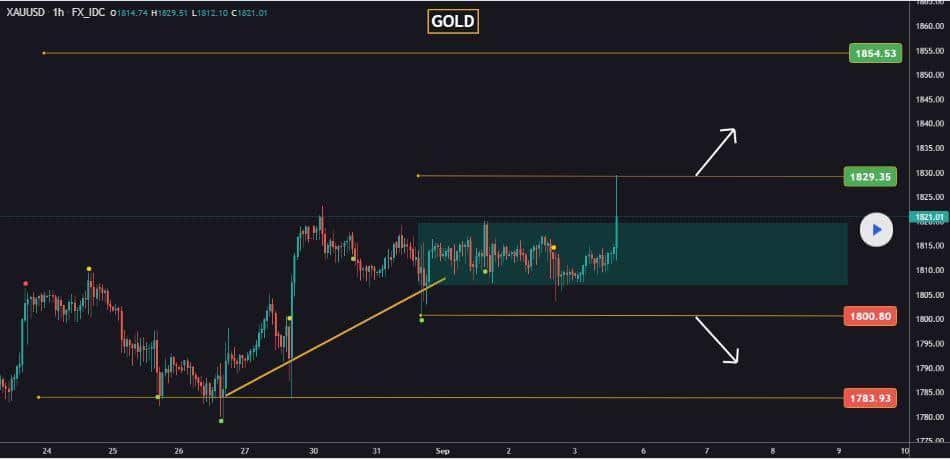
After the immediate release of NFP news, the above chart shows its impact on the forex market. The non-farm payroll data release indicates the United States’ economic condition and affects all USD pairs.
Before the data release, it is essential to analyze the chart according to technical indicators for pinpointing the correct entry point. The displayed chart shows the one-hour time frame of the XAU/USD pair.
As we can see, the price had been advancing upwards for 3-4 days. However, before the data release, the price had stopped climbing and was in a consolidation phase without any specific direction. Such scenarios highlight the imminent breakout in either direction.
Resistance and support levels provide an idea to traders about the possible continuation or reversal of price. Here, the holding of price above the support level for three days forecasted an upward breakout. Therefore, a good buy entry point for a bullish setup Is immediately above the support zone. In this case, 1808-1810 were appropriate points for a buy entry.
This technical analysis was successful only because the NFP data released was worse than the original forecast of 720k. The 250k actual value depreciated the dollar index, and the XAU/USD price shot upwards to 250 pips. Hence, we can say that during significant news events, technicals can turn impractical. But their efficient application with fundamentals can enhance the profit gain chances.
Where to put the stop-loss?
Your risk-taking capacity can also influence the stop loss placement. The appropriate stop loss for a bullish setup is below the lowest support level of your entry. In this chart, an appropriate stop-loss point was on or below the 1800 level.
Where to take profit?
It is essential to mark the price resistance when entering an extended position. It is because there are increased chances of price reversal after it hits the resistance zone. In this setup, the appropriate take profit point with minimal risk was the 1829-1830 level.
Bearish setup

Where to enter?
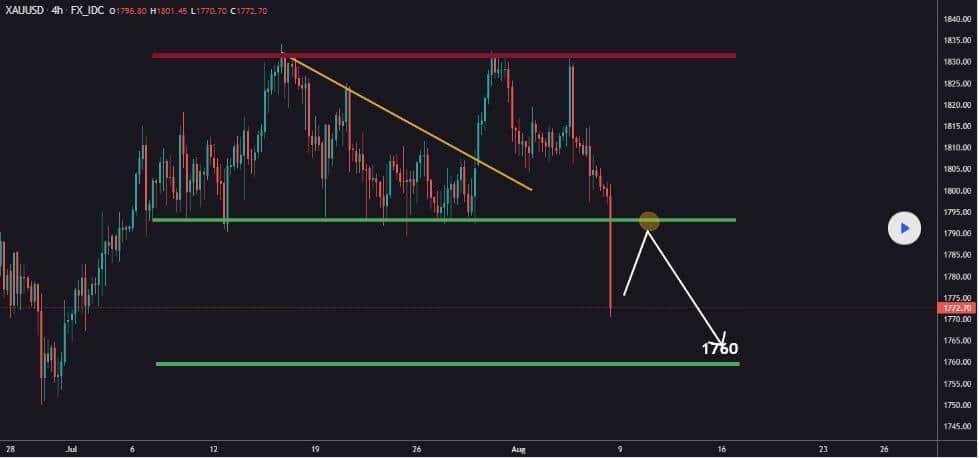
The above XAU/USD chart shows a bearish price action after a news release event. The above four-hour time frame chart shows that the market ranged between resistance and support zones for many days.
In this case, the NFP, major news releases grant the market with high volatility to break stubborn zones. Careful catching of this price action with the help of forex fundamentals can provide considerable gains to short-term investors and traders.
The analysis of the above chart before the news release presented two scenarios. The bouncing back of price from the 1795 level could lead to bullish momentum. In contrast, the breaking of 1795 support could stimulate further downside.
The triple tops on larger time frames indicate a possible bearish setup as the price fails to breach top-level numerous times. An excellent short entry point is after the closure of a big rejection candle. If the support zone breaks, it further strengthens the bearish bias. In the above chart, the appropriate entry point was below the 1795-1790 level.
In the above case, non-farm employment change released statistics were better than the forecast. The 943k figure then the actual 870k strengthened the USD strength index. As a result, the XAU/USD price dropped down significantly. The fundamental employment released data was the factor that initiated the breaking of the support zone and aggressive down momentum.
Where to put the stop-loss?
If your entry point is after breaking a support level, stop loss can be above the support zone. In this way, your trade can remain safe even if the price re-tests the level and stops out all novice traders. For example, in this XAU/USD chart, a suitable stop loss would be at the 1800 zone.
Where to take profit?
It is beneficial to optimize your trades with a good risk-reward ratio. “Next support level” or “resistance turned support” are the points where you should close all your short position trades. The price can rebound after touching this zone. In this case, the 1760 level would serve as a suitable take-profit point.
Pros & cons
Let us have a brief look over the pros and cons of fundamental analysis.
| Pros | Cons |
| Wider outlook It is a comprehensive analysis that considers macro-economic factors and quantitative data related to the specific company and country. | Does not consider market sentiment Financial markets can encounter wild swings due to fear or grade phases of traders. Unfortunately, fundamental analysis overlooks this consideration. |
| Fruitful for long-term investments It is advantageous for investors who prefer a long-term investment with gradual gains. | Complex process It requires ample research and time to monitor the positive or negative outcomes of a company’s finances. |
| Lower risk Thorough research and understanding before entering the market minimize the potential losses. | Does not identify good entry points Fundamental analysis is a broad methodology but cannot pinpoint exact entry or exit points. |
Final thoughts
Trades and investors value technical and fundamental analyses according to their style and goals. The employment of either method depends on your personal preferences and risk tolerance. In addition, you can mingle both techniques for proficiently achieving the required target. Trading and investing always come with potential risks, but you can avoid them by adopting a strategy that goes well with your methods and style.