Candles from Japan are older than the Western bar and have more than 100 years point charts. A Japanese trader in the 1700s named Homma found that the price of rice changed a lot because of the linkage between supply and demand.
Different candlestick charts reveal how much price has changed during a certain time frame. By being wide or rectangular, the “real body” of a candlestick points out how quotes are linked together at the start and end of a period.
It seems that most market participants prefer these candles because they can reflect multiple scenarios that can help them figure out if the trend will change or not.
What are bullish crypto candles?
Most technical analysts use candles to learn about the market movement and make trades. Various candlesticks patterns can be used to predict how prices will move in the future.
The candlestick designs are made by arranging two or more candles in a certain way. Even a single candlestick can give off strong signs from time to time.
How to earn using bullish crypto candles?
Even if you don’t have any other technical tools, candlesticks may be able to help you determine the general trend, resistance, and support lines. The patterns they produce can also serve as signals for buying and selling.
Candlestick charts are the best way to understand a stock’s price history. Patterns can be applied to aid in trading currencies, which are highly volatile and require extensive research. Using the candlestick chart, we can see many details about the price change. By contrast, the line graph shows only the closing price.
Top 5 bullish crypto candles
Let’s understand the market trends.
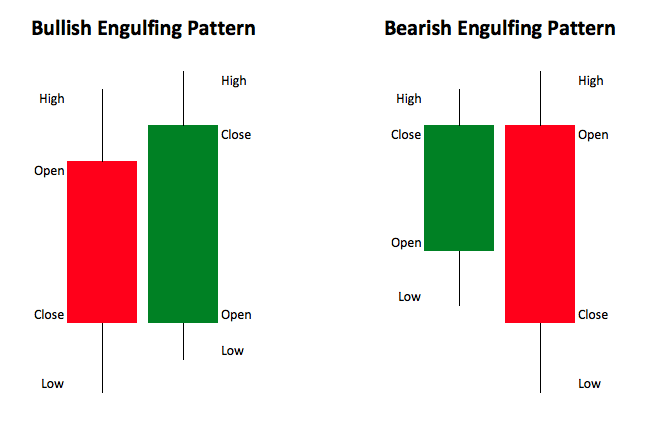
1. Bullish engulfing candle
The rising number of buyers has historically been a sign that the market will turn around, and prices could rise. This pattern consists of two candles, with the second candle covering the wick and body of the first red candle.
In some situations, the price starts out lower than the day before but then increases throughout the day. When this pattern appears, it is best to wait for the next candle to increase its price.
If you want to buy or sell in the same manner as before, wait until the second candle closes above the price at which it started. Every transaction must be based on context and location.
Due to the 24-hour nature of the market, there aren’t many gaps between candles. As a result, candles open higher or lower than those that came before.
2. Bullish hammer
At the bottom, the wick is long, but the body is short. As a result, a new wave of buyers pushed the price back up after the price dropped for a while.
A candle’s body and tail should be both long. As long as it is modestly shaped so that it can be considered a bullish hammer, regardless of how lower the close is than the open.
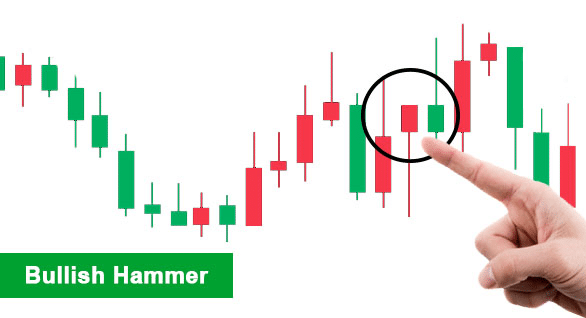
Those who are cautious will wait for confirmation of the direction change through successive bullish candles and increased purchasing volume before making a move.
3. Three white soldiers
Several long green candles with tiny wicks compose the structure of this candle, each opening and closing higher than the previous day. Investors are willing to keep putting money into the market as the price grows, which is a positive sign.
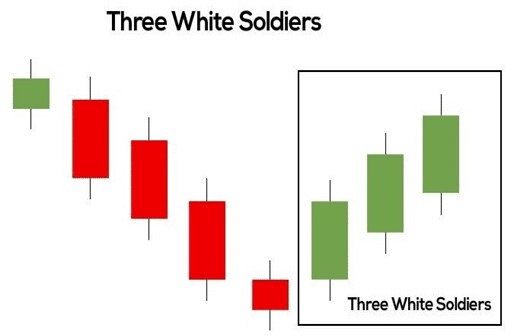
In this scenario, bulls were able to keep the price above the range for the entire duration of the candle when the shadows were few or nonexistent.
4. Rising three methods
This pattern consists of three small bearish candles arranged between two larger bullish candles in a triangle shape. The market is still under pressure from sellers, but purchasers significantly influence prices.
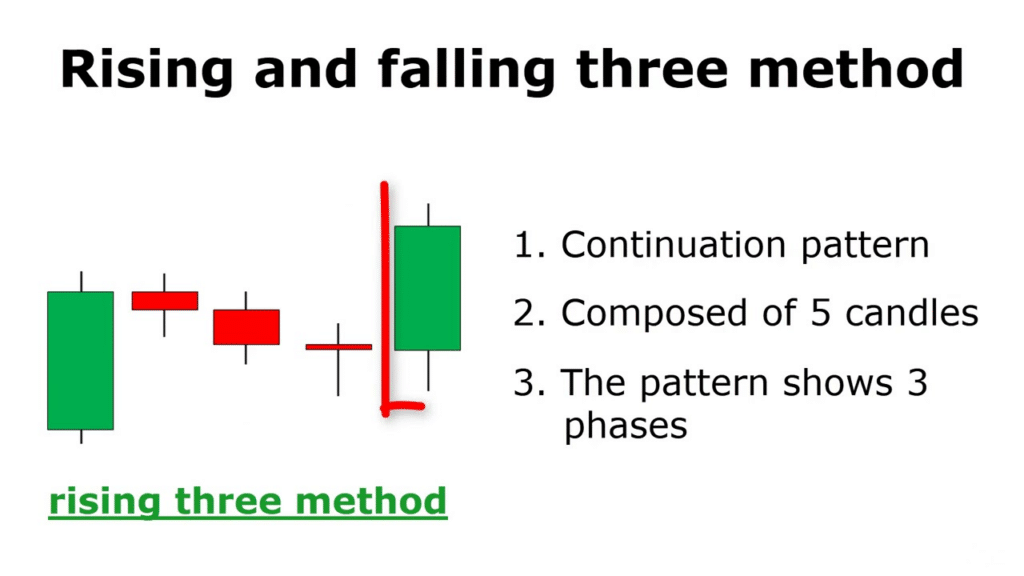
A rising three methods pattern may appear as an ordinary bull flag or falling wedge, but it is an unusually complex pattern combining three distinct trading approaches.
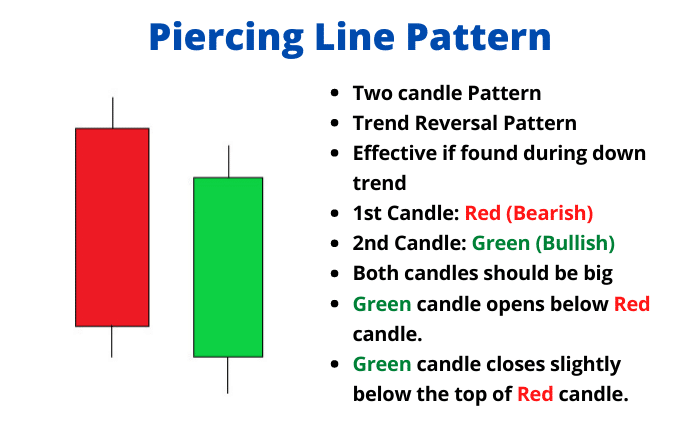
5. Piercing line
It is evident in this pattern that the closing price of the first candlestick was much higher than the price at which it was drawn. Non-trading hours are markedly slower than trading hours because of the decrease in volume.
Unlike the first bearish candle, the second bearish candle closes more than halfway up the first bearish candle. Nevertheless, it appears that purchase pressure is increasing during the candle. A bull’s return to power and willingness to buy at the current price is evident by the fact that this is exactly what happened.
Pros & cons
Here are the major pros and cons of bullish crypto candles.
| Pros | Cons |
| Most indicators work well on candlestick charts. Therefore, candlestick charts are often used when signs are needed for a particular trading strategy. | A single bullish bar might represent an entire trend or a single parabolic outburst. We won’t know till we zoom in on the candlestick pattern or look at lower time frames. |
| A single candlestick can be used to show any period that is linked to any asset. | Sometimes one candle closes at one level while the next opens at a different level. |
| These candles are easy to understand. | These visualizations may show biases sometimes. |
Final thoughts
Bullish crypto candles are trendy among crypto traders because of their visually appealing look and ease of reading. The practice has been modified and improved upon several times during the period of its likely beginnings in the Japanese rice trade, which dates back thousands of years.
You may use bullish crypto candles to gain a feel of the market’s overall direction. These patterns are popular among traders because of their favorable risk/reward ratio and ease of application.