You cannot downgrade the importance of trading with a solid plan or trading method. Either you find one or develop your own if you take currency trading as a serious business. In this article, we will introduce to you the moving average (MA) intraday system. As the name suggests, you will enter and close trades within the day, and you will focus on lower time frames for entry and exit.
What is the moving average intraday system?
This trading system is a common strategy used by traders. You can find similar systems anywhere online. The MA is a versatile trading tool that you can pair with other technical indicators to develop a manual or automated trading system.
Here we will look at trading opportunities that arise if you combine the MA with the MACD.
- The MA is your main entry trigger, while the MACD confirms or contends the signal.
- The MACD seems to perform its role splendidly, recanting many calls from the MA and price crossover.
Indicators to use
This trading system makes use of a couple of technical indicators for trade entry. Quite probably, you are already familiar with these indicators. Therefore, you can trade this system regardless of your trading experience. The indicators you will add to your chart are the following:
- Exponential moving average (period 11)
- Moving average convergence divergence (standard settings)
Chart setup
You have to set up your chart in the manner prescribed by this system. Follow the steps below when setting up your chart:
- Open any chart
You can trade this system with any symbol on your platform. Our suggestion is you select pairs that tend to trend rather than range. The purpose is to get as many pips as possible in every trade you take.
- Use a candlestick chart
You will employ a specific candlestick in your trade entries, so you need to see the individual candles. Zoom in if needed.
- Put the time frame to 30 minutes
Since this is an intraday system, you can use the lower time frames. Of course, you can trade the one minute, five minutes, and 15 minutes. It depends on your available time to watch your charts.
Entry rules
To enter the trade, you must follow the MA closely as it interacts with the price. We are not interested here whether the price is above or below the moving average. We want to see a particular event, that is, price crossing above or below the MA. Let us now discuss the buy and sell setups.
Buy setup
- A big bullish candle must cross and close above the MA. Not all such crossovers are considered valid, though. We want a specific crossover to transpire. The MA must penetrate the center of the candle body, not the lower or upper part nor the wick.
- The bullish crossover should occur while MACD is above the zero lines. If the MACD is still below zero, we have to pass up on the buy trade.

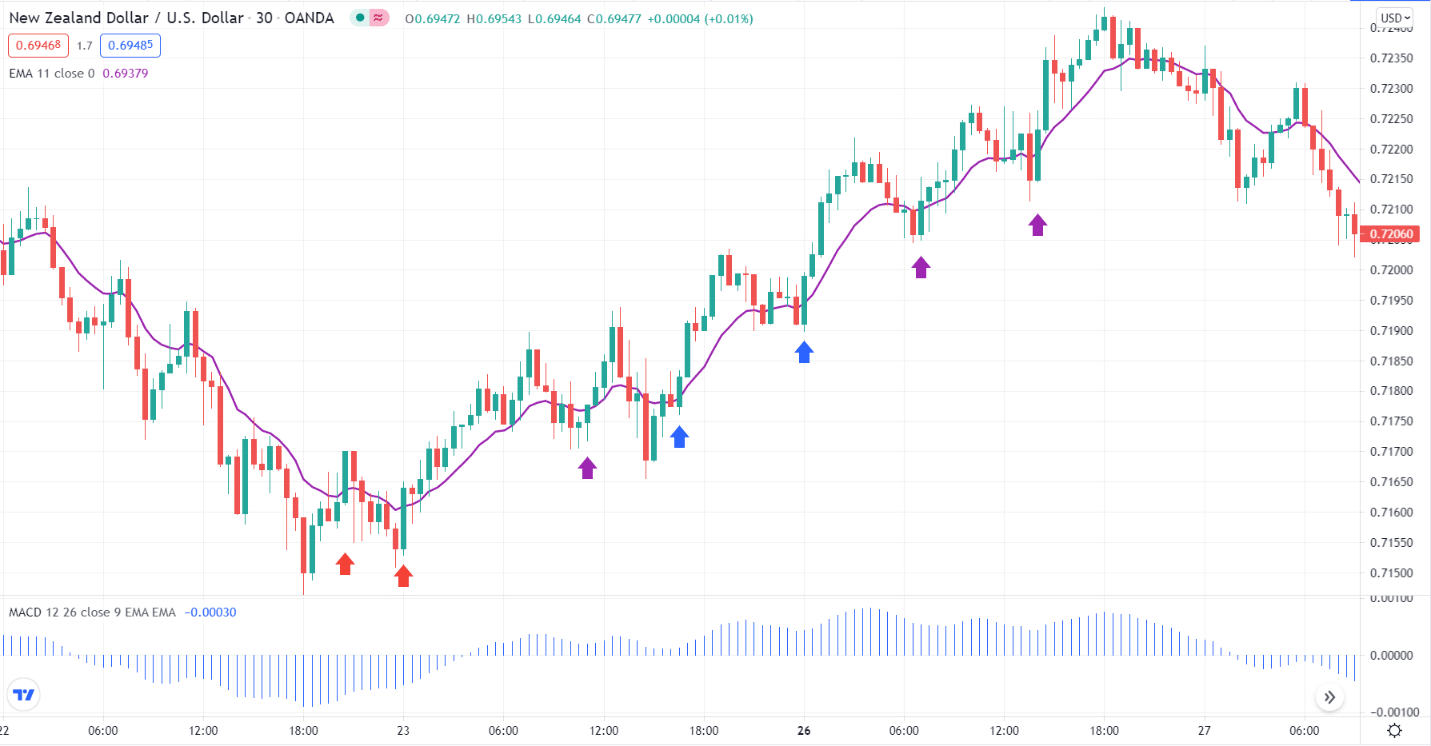
Let us consider the above NZD/USD 30-minute chart. The first two crossovers marked by the red arrows are not valid because MACD is still below zero. The third up arrow (violet) is also not correct because the MA crossed the upper part of the candle.
The two up arrows in blue are the valid buy setups. As you can see, the MA penetrated the middle of the candles, and MACD is more significant than zero. The last two up arrows are not viable since the current upswing has been winding for much too long. We can expect a reversal anytime soon. The setup is tradable, but the risk increases.
Sell setup
- A big bearish candle must cross and close below the MA, and the MA should penetrate the middle of the candle body. A penetration at the upper or lower body or even the wick is not as profitable.
- The bearish crossover should occur while MACD is below the zero line. If MACD is still above the zero line, just let the trade pass.

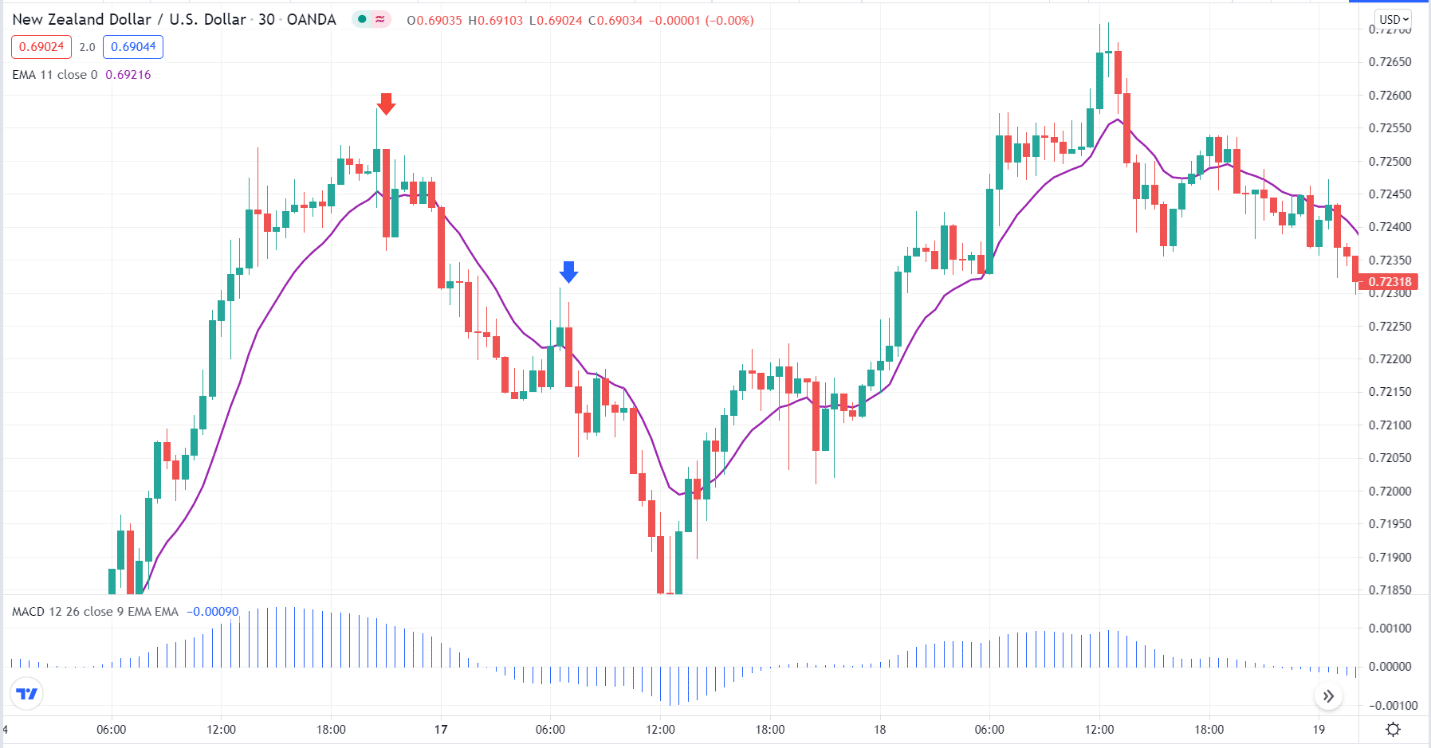
Let us take the same NZD/USD chart, but this time we look for sell setups. The first down arrow in red is not valid because MACD is above zero. The second down arrow in blue is ideal because the MA penetrated the middle of the big bearish candle, and MACD is below zero.
Exit rules
In terms of stop-loss, you have two options to choose from. It depends on the price action surrounding your entry. You can put your stop loss on either of these locations:
- High or low of the previous two candles. Often an engulfing pattern forms when the MA and price cross, with the MA penetrating the engulfing candle in the two-candle combination.
- Swing high or swing low. If the above option leads to a stop loss that is too close to the entry, you can use this second option. Here you put your stop loss at the nearest swing high or swing low.
At the other end of the spectrum, you have greater freedom to set the take-profit target. Perhaps the most accessible and most suitable is the fixed reward-risk ratio. Consider using a percentage more significant than one. The best ratio is two. Therefore, place your take profit to a distance of two times the distance between your entry and stop loss.
Typically, you will use the recent swing low or swing high as your dynamic stop loss location. As an alternative, you can use a trailing stop and no specific take profit. With this approach, you will adjust your stop loss as your trade gains more pips.
Final thoughts
If you have given the trading system above a serious thought, you must have figured out that it attempts to trade a strongly trending market. The MACD serves to filter many signals issued by the MA and price crossover.
Because of the MA and MACD combination, you cannot trade market reversals. However, you will be able to ride a strong trend. At the beginning of a new trend, you will have to wait until the MA and MACD align. You will reject several trade chances, but the benefit is you take only the high-probability trade entries in the direction of the trend.