Swing trading is a way to make money from forex marketing using the characteristics of zigzag nature. You can make your trading effective and more profitable than a general trader by taking a perfect entry.
The FX does not move straight as millions of traders continuously buy and sell here. As a result, the price moves by creating swing low and swing high and smart traders can anticipate the future movement by overseeing those swings. If you are a swing trader or want to create a trading strategy using market swings, this lesson is for you.
Let’s see a complete guideline on swing trading applicable to any trading instrument in the world.
How swing trading works in the forex market
The global FX is open 24/5, and traders all around the world are participants. Moreover, prominent institutes and multinational companies regularly need foreign currencies to operate their international business in this marketplace. As a result, buyers and sellers remain present all the time in that place.
Therefore, the price movement does not change immediately. There is always room for a bearish correction in a bullish trend and a bullish correction in a bearish trend, creating price swings. Most swing traders in this market hold their trades for more than a day and consider this strategy as middle-of-day trading and position trading. Moreover, using higher time frames in swing trading is also profitable.
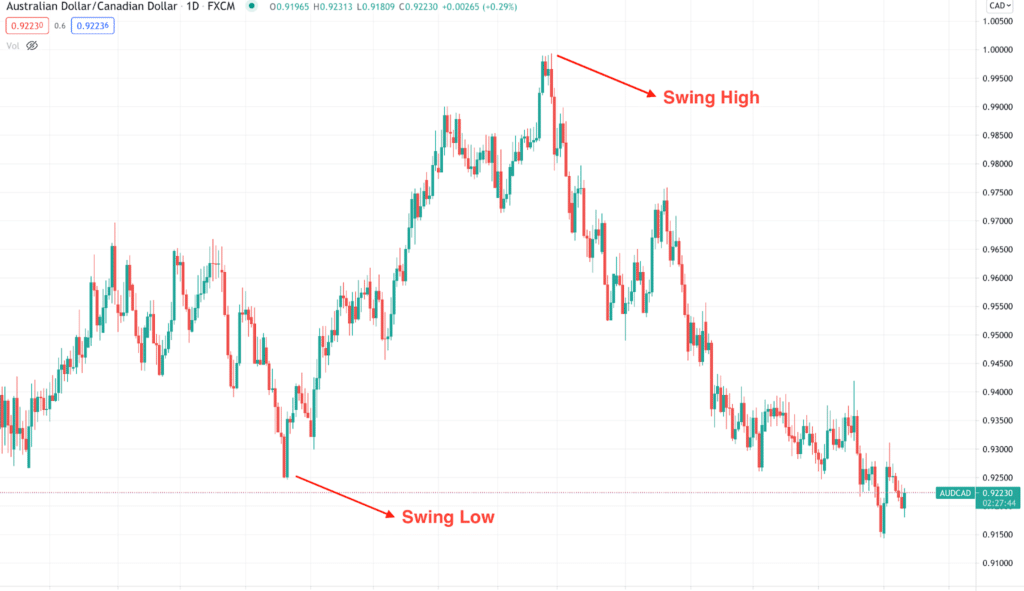
The above image shows how the swing low and high formed in the daily chart of AUD/CAD; from here, a decent bullish and bearish pressure started.
Understanding swing levels on a lower time frame
In every trading strategy, the higher time frame always provides the best result. However, moving to a lower time frame is a process to eliminate the trading risks. In retail trading, one of the most significant risks is regarding trade management. The higher time frame requires higher stop losses that a usual retail trader cannot afford.
Therefore, traders should move to a lower time frame to see what is happening inside the room to define the more accurate swing levels. So let’s see how we can move to a lower time frame and find the most precise trend direction.
Identify near term levels
In this approach, we will closely monitor the price action at the intraday chart as soon as the price reaches any significant swing level. More particularly, we will focus on intraday event-level, that world as both support and resistance together. It is the most effective price level in the world where both buyers and sellers remain active.
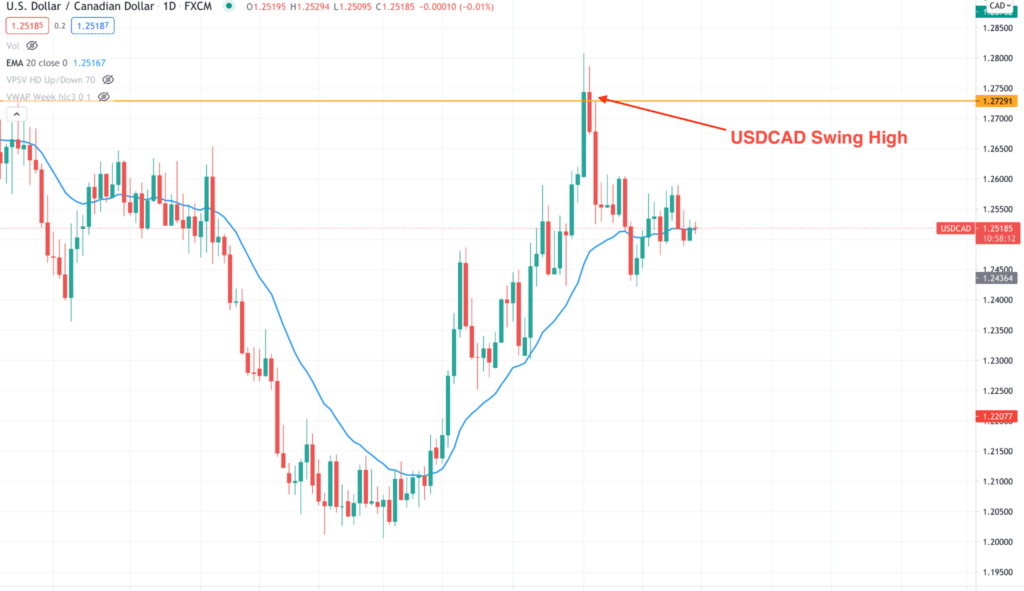
The above image shows a swing high formed in the USD/CAD daily chart from where we will look for a sell trade.
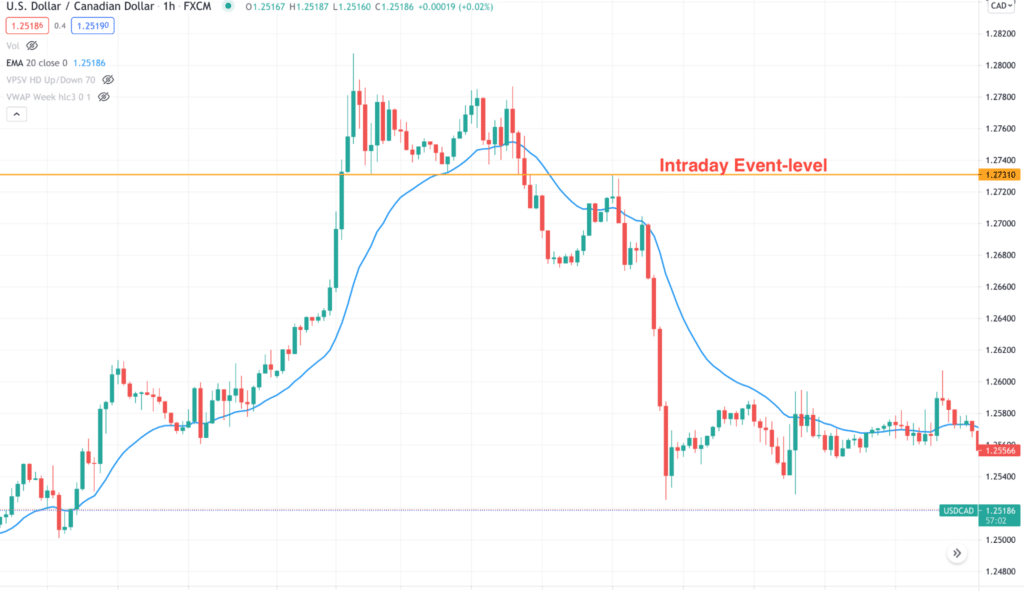
The above image shows how the intraday event-level formed in the H1 time frame. First, the price moved above this level and took support. Later on, the price moved down and retested it as resistance before moving lower.
Find a corrective price
Here the corrective price means buyers and sellers become indecisive, and a strong movement may happen once the correction is over. Find a corrective price at the event level for a sell trade and wait for a break below it. Similarly, for a bearish swing point, wait for a corrective price at the swing level and identify the price above the event level.
Let’s have a look at a practical example of a corrective price in the intraday chart.
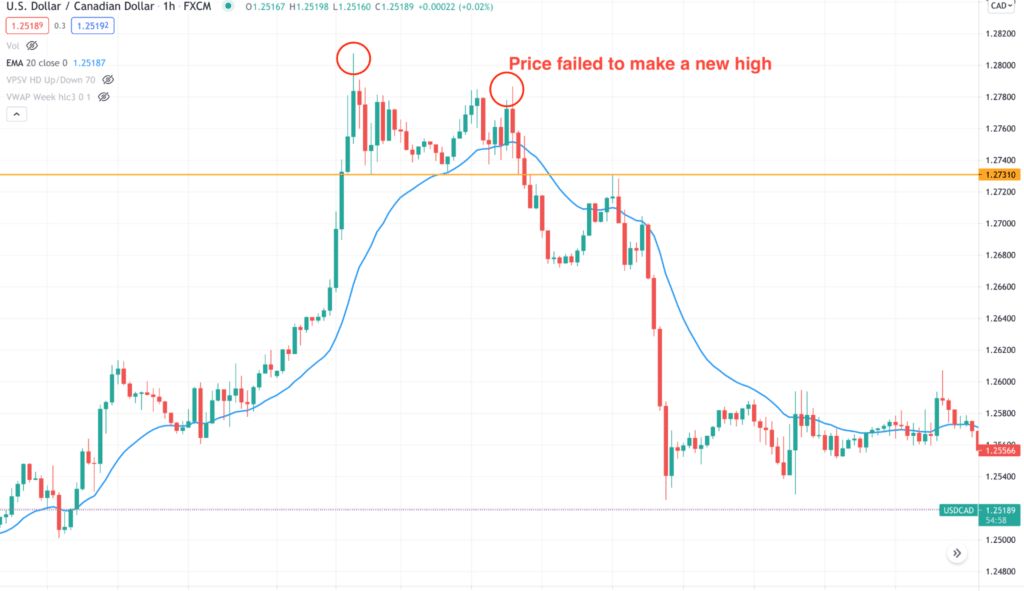
In the USD/CAD H1 chart, the price failed to make a new high, although the price was at the swing high with an intense buying pressure. As a result, the price moved down below the event level with massive bearish pressure.
How to open trades?
After finding the perfect location and direction, it is time to take a trade. In any system, the entry point should be perfect by observing the candlestick. A buyer’s failure in the selling market is ideal for opening a sell position, but how can we be sure?
Let’s say we are at the higher time frame swing high and looking for a sell trade with a hope of an upcoming bearish swing. In the intraday chart, we aim to find only selling opportunities. Therefore any bearish rejection from the intraday event level is mandatory for taking sell trades.
The bearish rejection might be a bearish pin bar, two bar, engulfing bar, or outside bar.
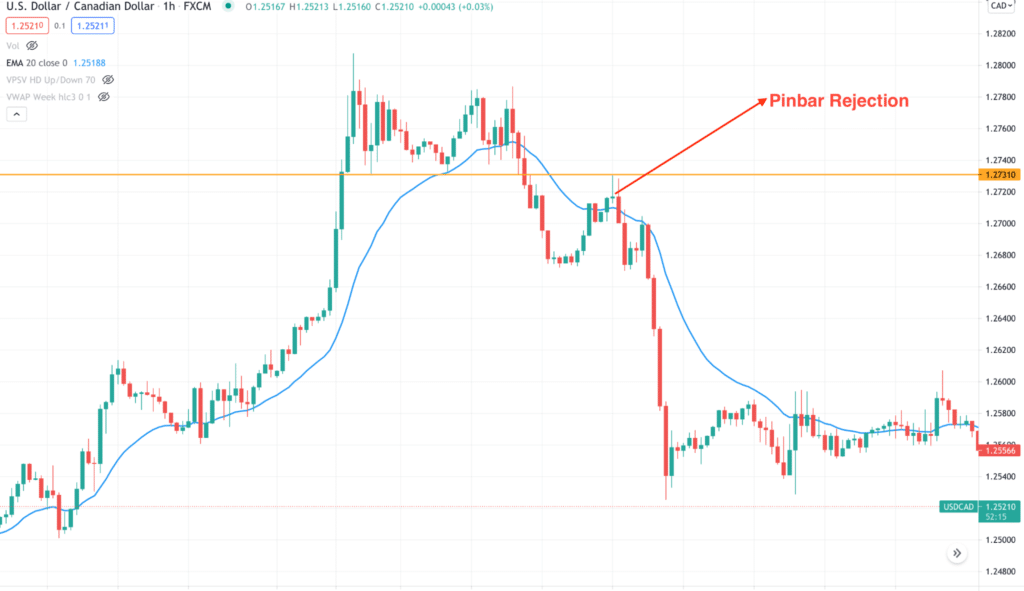
The above image shows how bearish candlesticks form in the intraday chart. Make sure to open the trade as soon as the candle closes. You can put a sell stop below the candle or wait for a correction after the candle closes to minimize the risk.
The stop loss should be above the candlestick pattern and intraday level with some gap of 10 to 15 pips. It will help you to eliminate unexpected stop loss hits and reverse.
Trade management guide
Although we have considered higher time frames in finding the swing level, the critical event happened in the lower time frame, mainly we aim for H1. So if you see swing levels at H4 or D1, make sure to take trades on H1 of m15.
After taking the trade, it is time to manage it. In every trading system, following some rules are mandatory:
- Never take more than 2% risk per trade.
- Before starting trading, make sure to follow the strategy in the demo account or with a lower balance.
- After taking the trade, make sure to close 50% of the position after hitting 1:1, risk: reward.
- Consider market context, the overall trend, and the fundamental outlook of a currency pair while opening a position.
Final thoughts
After the above discussion, we can conclude that the perfect entry point in swing trading is lower than its original time frame. Moreover, to get the maximum benefit from the market, you should follow strong money management rules and a trade management system.
In every trading strategy, we analyze the market and take trades based on probabilities. Changing the time frame and implementing price action increases the trades probability.