How can you find the best entry points for crypto trading? This is something that a lot of people struggle with. You can start by using technical analysis. However, you will not be able to locate the perfect entry or exit. The goal is to keep your cool and stick to your plan. In addition, indicators are a valuable aid for finding good entries.
So in this article, we will discuss how the best entry points are identified using this analysis.
What is technical analysis?
As a crypto trader, you might have seen many price pumps and dumps come and go. You’ve probably looked yourself in the mirror and asked why you didn’t sell the top and buy the dip. After all, the crypto market ebbs and flows right.
Changes in supply and demand cause price variation in the crypto market. When there is more supply than demand, prices fall, and when demand outnumbers supply, prices increase. The way a trader understands this is through such analysis.
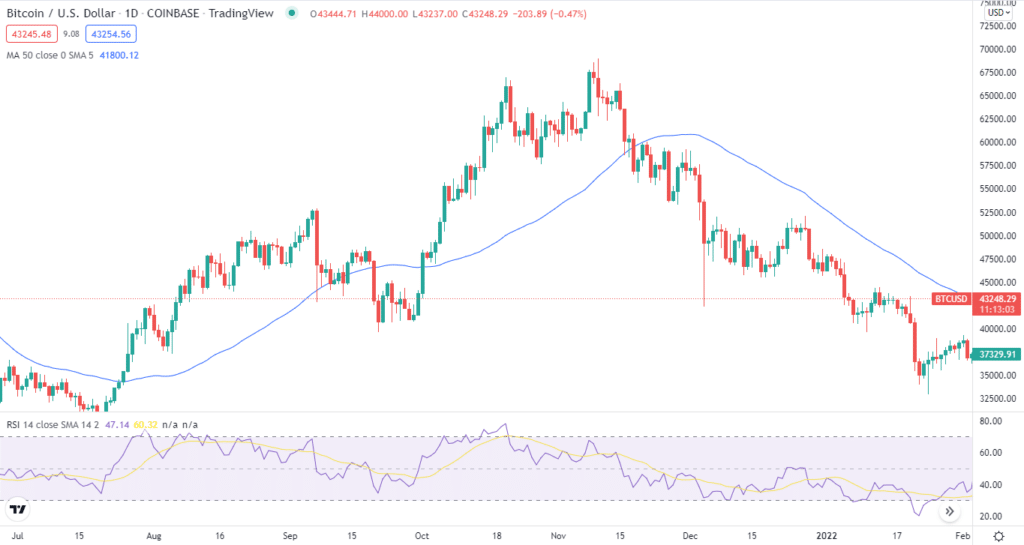
Technical analysis is a method for analyzing historical market movements and forecasting future price fluctuations. However, to use such analysis to comprehend price swings, you should consider things like previous and current crypto demand, worldwide regulatory regimes, and recent changes in the crypto community, among other things.
Analysts search for patterns and analyze previous data such as price and volume. Charts are the fundamental base in crypto technical analysis. Candlestick charts best represent this specific market.
How to identify the best points to enter?
Technical analysis allows market participants to predict the performance of a market in the future based on past movements. It also enables a trader to identify patterns of price movement. One of the essential concepts of this analysis is to make entry points easy to locate.
We will discuss how we can use some of the technical ways to identify entry points in a trade.
Candlestick pattern
It is the most frequently used and effective tool for traders during technical analysis. The good thing about this is that the pattern shows four different points that may be useful for the trader depending on what they are looking for. These points are high price, opening price, closing price, and low price.
Traders use a single candlestick or a group of candlesticks to calculate their next move in the market. This is done with the help of support and resistance levels.
Bullish trade setup
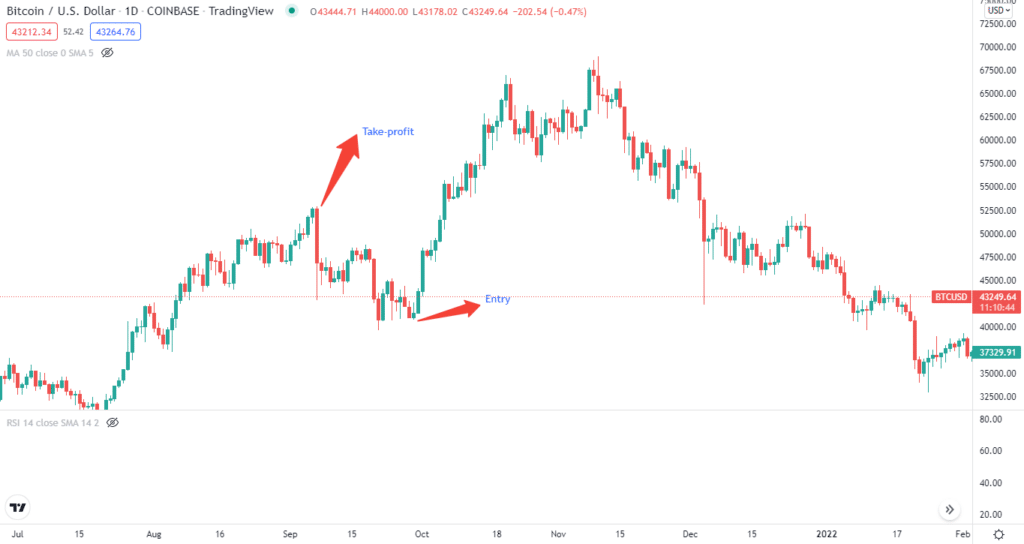
A candlestick continuation from the resistance level or a reversal from a support level indicates a possible buying opportunity.
Entry
We can enter at the support level.
Stop-loss
You can place the stop-loss at the recent low.
Take-profit
You can place the TP at the recent high with a 1:2 risk/reward.
Bearish trade setup
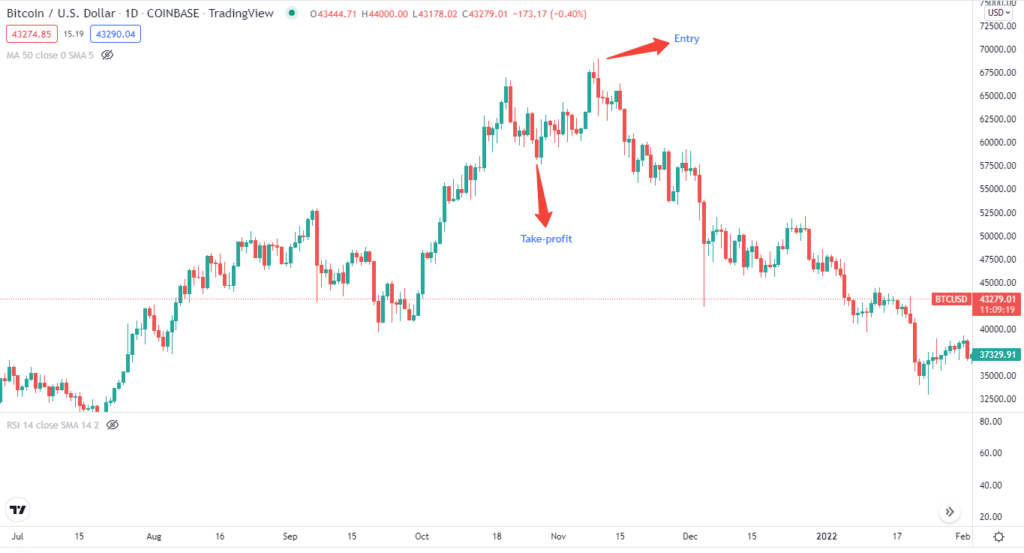
A candlestick continuation from the support level or a reversal from a resistance level indicates a possible buying opportunity.
Entry
You can enter at the resistance level.
Stop-loss
You can place the SL at the recent high for bearish trade setups.
Take-profit
Place a TP at the recent low with 1:2 risk/reward.
Trend and momentum
Another way to determine the right time to make an entry is by assessing the trend. For example, in an impulsive trend, the price is likely to make new highs or lows, with aggressive buying or selling pressure. This aggression is what we call momentum.
A trader will prefer to sell if the market is impulsive. Of course, they would have figured their entry point with the help of the trend and momentum of the market.
Trends are presented graphically in trend lines, which trades then use to make the appropriate conclusions.
Bullish trade setup
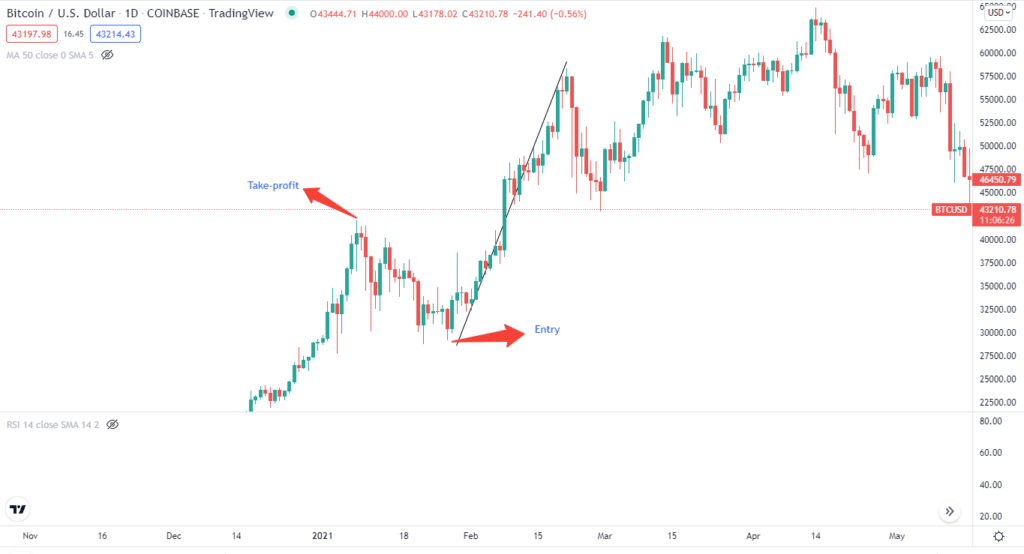
Looking at the uptrend can determine a bullish setup.
Entry
You can enter after drawing a trendline. You can wait for the trend to develop fully for a more conservative approach.
Stop-loss
Determining SL for trend trading is similar to candlestick setups. First, you must choose a recent low point and place SL for a bullish trade setup.
Take-profit
You can set the TP at the recent high with a 1:2 risk/reward.
Bearish trade setup
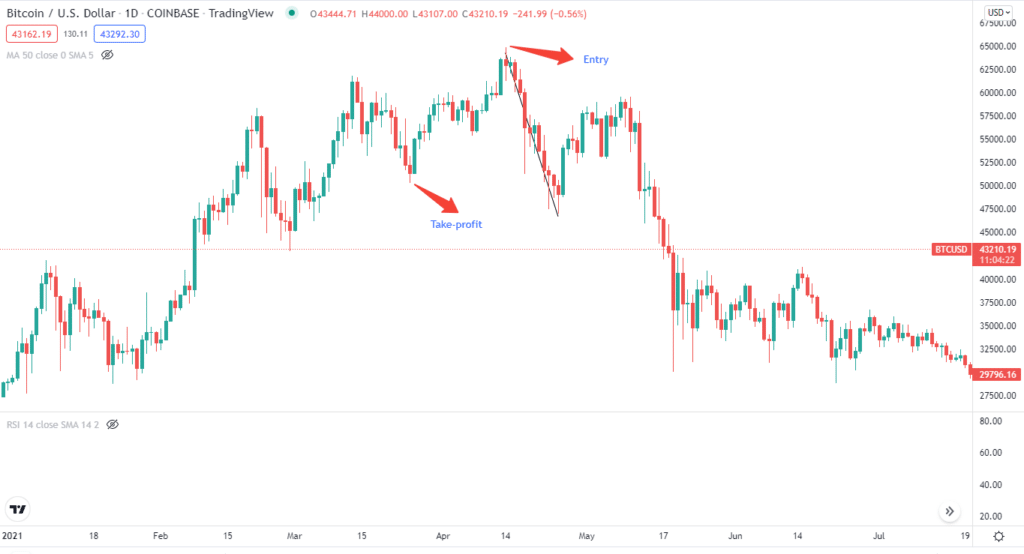
Looking at the downtrend can determine a bearish setup.
Entry
You can enter after drawing a trendline. You can wait for the trend to develop fully for a more conservative approach.
Stop-loss
Opposite to the bullish setup, you can place the SL at the recent high.
Take-profit
You can set the TP at the recent low with 1:2 risk/reward.
Moving averages
Moving average, or MA, is a technical indicator. This is useful for determining the strength and direction of a trend. In addition, traders anticipate the movement of price.
MA is not a constant value, but it changes as the price changes. Therefore, long-term and short-term price analyses have their formula for finding the moving average. A long-term MA is called a simple moving average (SMA), and a short-term MA is called an exponential moving average (EMA).
A long-term moving average is considered a stronger indicator because of more data.
Bullish trade setup
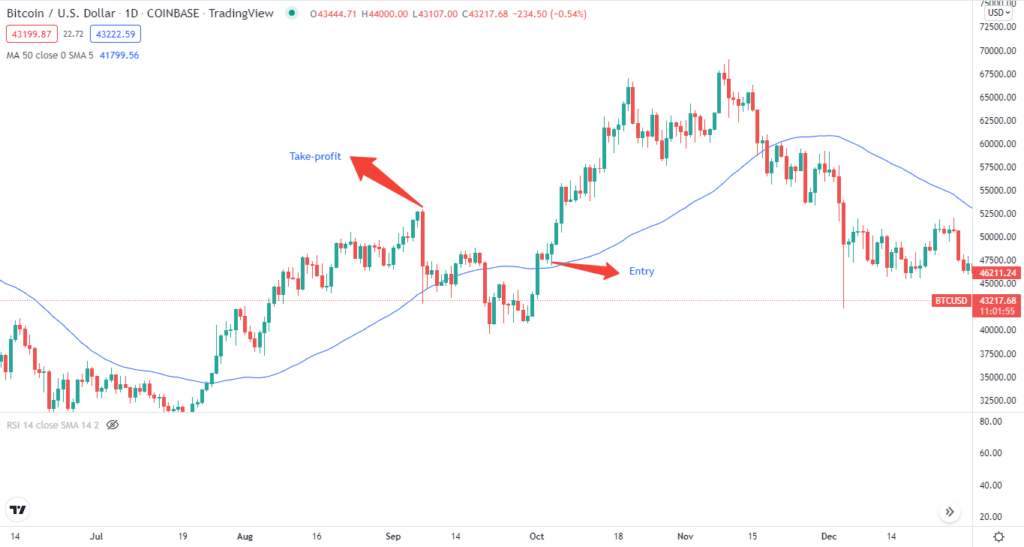
You can find a bullish momentum if the price is above the MA.
Entry
When the price starts moving above the MA, you can go long.
Stop-loss
After finding an entry point, you can place the stop-loss near its recent low.
Take-profit
You can set the take-profit at the recent high with 1:2 risk/reward.
Bearish trade setup
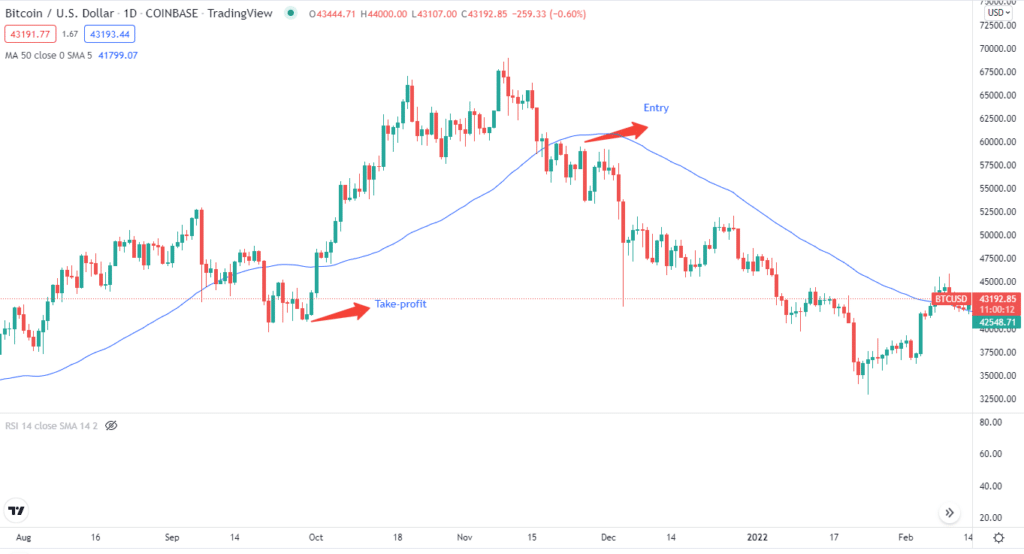
You can find a bearish momentum if the price is above the MA.
Entry
You can place a short trade when the price moves below the MA.
Stop-loss
You can place the SL at the recent high for the bearish strategy.
Take-profit
You can set the take-profit at the recent low with 1:2 risk/reward.
Relative Strength Index
The relative strength index, or RSI, is useful for novice traders. Perhaps this is because it is pictured as a simple line graph below the price chart. Specifically, it is a momentum indicator, which shows overbought or oversold conditions. It marks values on a scale of 1 to 100.
Bullish trade setup
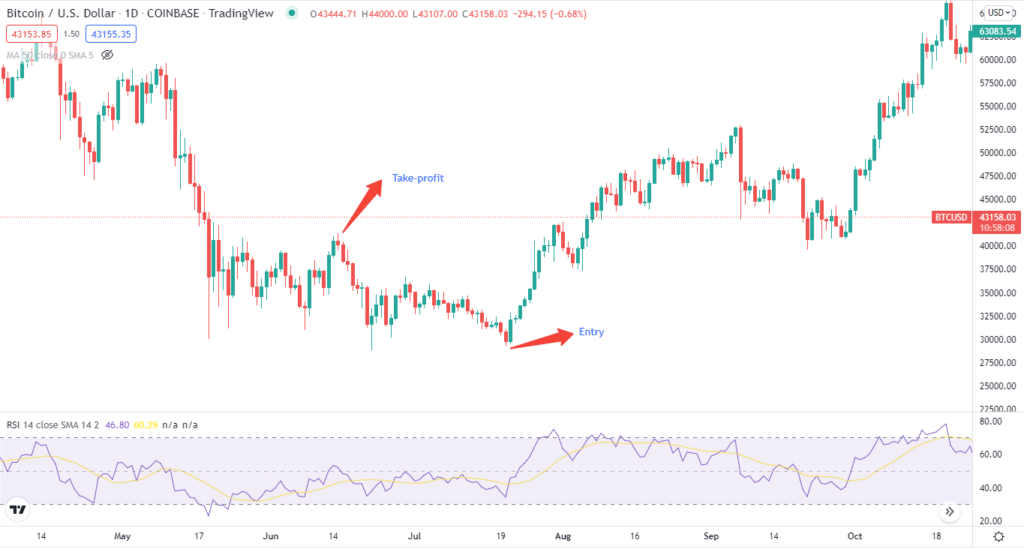
A value above 70 signals an oversold area. The crypto was overbought, and the price is expected to bounce.
Entry
You can enter after the RSI reaches below 30.
Stop-loss
You can place the stop-loss near the recent low of the entry point.
Take profit
You can set the TP at the recent high with a 1:2 risk/reward.
Bearish trade setup
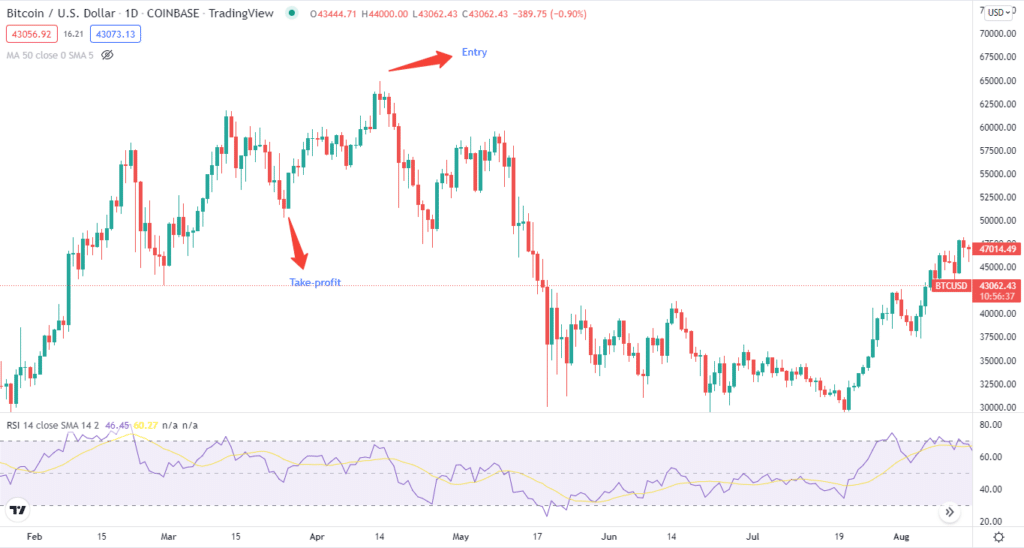
A bearish pressure in the market is predicted if the RSI value goes above 30.
Entry
You can enter after the RSI reaches above 70.
Stop-loss
You can set an SL near the recent high of the entry point.
Take-profit
You can set the TP at the recent low with 1:2 risk/reward.
Is crypto technical analysis profitable?
Technical analysis is an essential tactic in the crypto field. This analysis provides sufficient power for traders to understand and grasp the market direction. You can apply many indicators like the RSI, MA, MACD, and others in your strategy.
Pros and cons
| Pros | Cons |
| This analysis allows you to respond quickly to market changes. | This analysis does not take fundamental factors into account, thus affecting the market’s movement dynamics. |
| It enables you to identify changes and make a trading decision effectively and rapidly. | Individual indicators provided by the technical analysis are not effective. |
| It helps you devise your strategies based on the trading tools. | It requires high traders’ accuracy, which is developed through long practice. |
Final thoughts
There are several different ways a trader can identify the entry points. The entry point can either be where they sell crypto or the particular point where they buy crypto. Technical analysis allows traders to determine these entry points with greater accuracy.