Moving averages (MA) are among the most widely used technical indicators in the financial market. Market participants rely on this tool, including various positive features such as simplicity, availability on exchanges, effectiveness, etc., alongside generating swing trading ideas. You can consider this concept of moving as a foundation of many sustainable trading strategies.
However, when choosing MAs to generate crypto swing trading ideas, it is mandatory to have a certain level of knowledge and understanding about the concept and use a procedure of expert crypto investors. This article will introduce the MA crypto swing trading strategies with chart attachments for better performance.
Moving average explained
MA is a technical indicator that works with a series of price change data over a particular period. For example, a simple moving average (SMA) of 20 days will collect the information of those days’ price change and divide that by 20 to get the average price of that period.
This tool works with various parameters of the price candles, including opening price, closing price, highest/lowest price of that period, etc. There are several types of MA available that traders use, such as:
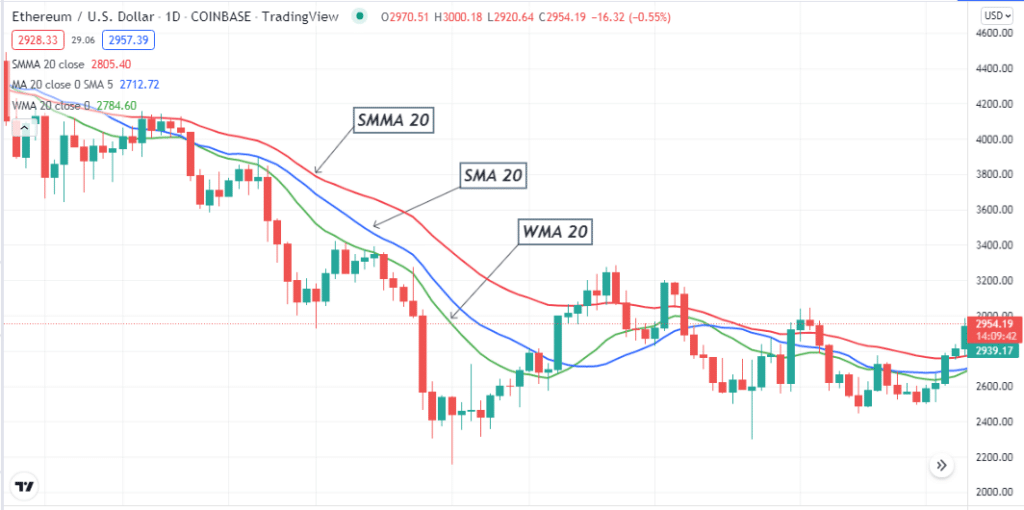
- Simple MA (SMA)
- Exponential MA (EMA)
- Smoothed MA (SMMA)
- Linear weighted MA (LWMA)
- Hull MA (HMA)
These MAs calculate the market data by different formulas to obtain the market context.
Why use moving averages in crypto swing trading?
You can group swing trading among speculative trading techniques that traders catch by conducting various technical and fundamental analyses. MA has become a popular technical indicator to financial traders, including crypto investors, as it involves various functionalities. It helps to determine swing points, current trends, trend switching points, support resistance levels, etc.
So it is easy to identify any erratic short-term spikes using MA indicators. Moreover, it’s easy to identify trend-changing points using different MA parameters that crypto investors can use to exit from their swing trading positions. So many expert crypto investors prefer this indicator for swing trading.
How to use MA indicators for crypto swing trading?
MA indicators are easily applicable universal tools that you can use for generating trade ideas for almost any financial trading asset. A significant number of crypto investors use MA indicators while making trade decisions.
For example, you may use a 50 Day MA for your crypto trading practice. When the price crosses above that MA line indicates a buyer’s domination at the asset price and enables buy trading opportunities. Again, the price reaches below that MA line declaring sellers’ domination on the asset price.
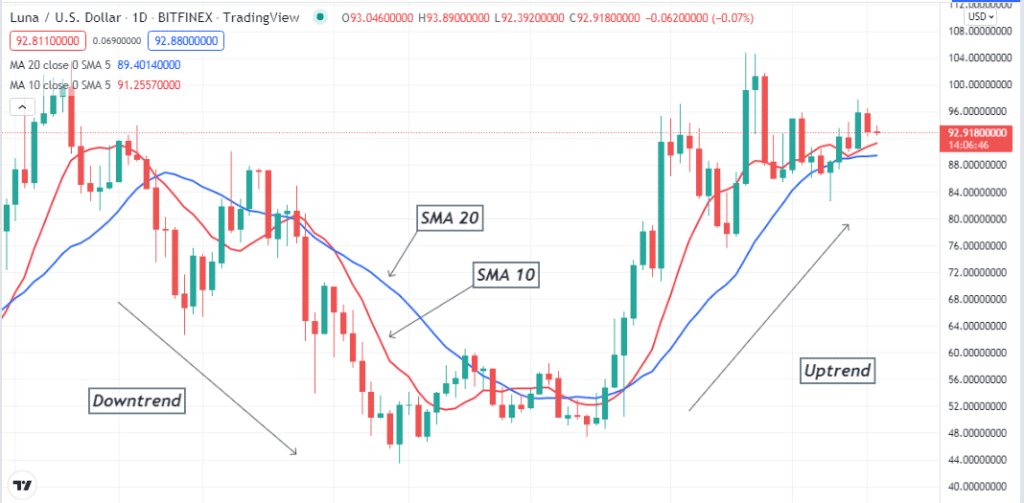
The MA crossover concept is another popular option for crypto investors to generate crypto swing trading ideas. In this case, they use two different MA lines. When the MA of a short parameter gets above the MA of a bigger parameter number declares a bullish force on the asset price and identifies a swing point signaling a buying opportunity.
On the other hand, the exact opposite crossover between those MA lines declares a bearish momentum and opens selling opportunities to crypto swing traders. The preferable MA parameters crypto swing traders frequently use 21, 50, 100, 147, 200, etc.
Moving average crypto swing trading strategy
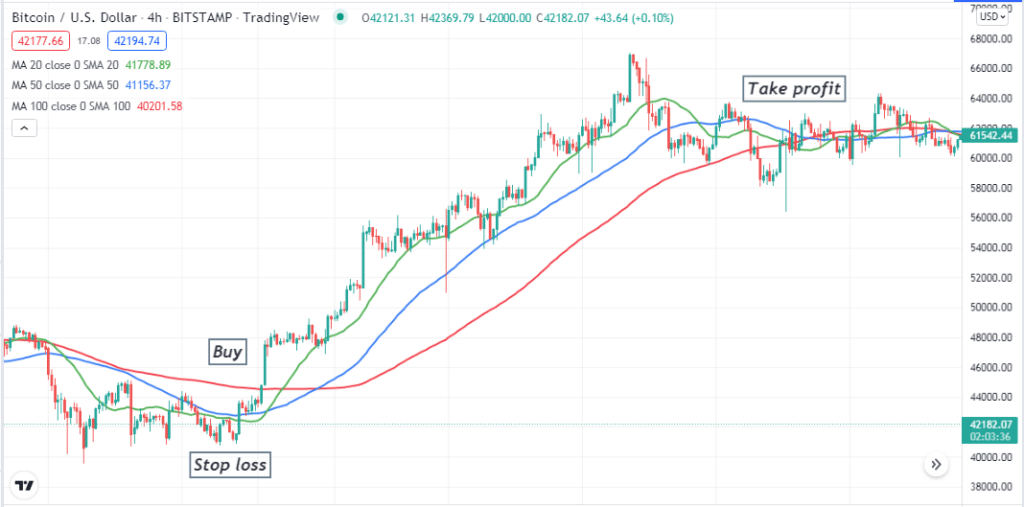
This trading method combines the MA crossover concept to generate the best crypto swing trading ideas. We use three different SMA in this trading method SMA 20 (green), SMA 50 (blue), snd SMA 100 (red).
The red SMA defines support resistance levels or determines trends. Meanwhile, the green and blue SMA lines crossover determines the swing points and suggests entry/exit positions of trades. This swing trading strategy suits many time frame charts. We recommend using at least a 15-min or above time frame chart to get the best results.
Crypto swing trading buy strategy
- Apply all three SMA indicators to your target asset chart.
- The price gets above all three SMA lines.
- The green SMA crosses the blue SMA on the upside.
- Both the green and blue SMA lines reach above the red SMA.
- The price may start a bullish trend in this state, open a buy order.
- Set an initial stop loss below the crossovers and the current swing low.
- Close the buy position when the uptrend ends.
- The green SMA drops below the blue SMA line.
- Both the green and blue SMA lines drop below the red SMA line.
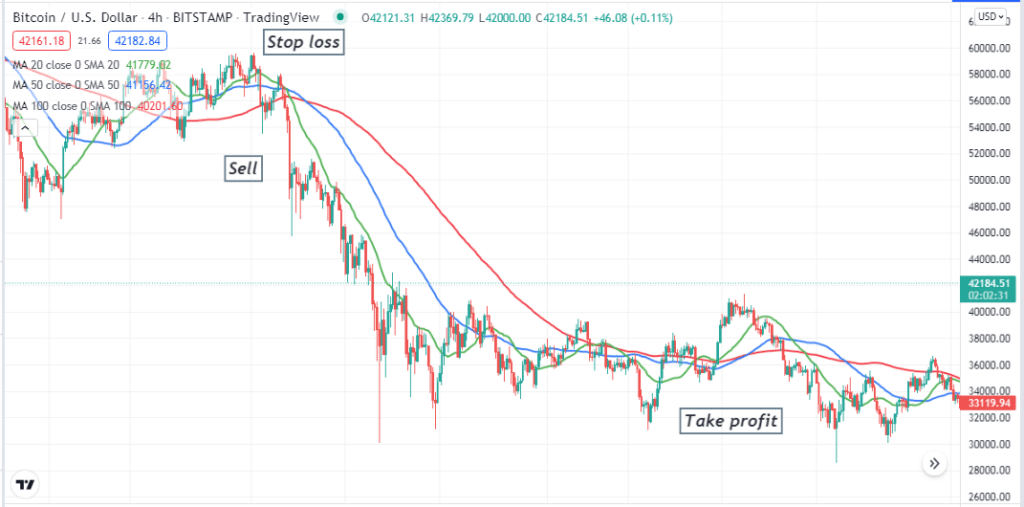
Crypto swing trading sell strategy
- Apply all three SMA indicators to your target asset chart.
- The price gets below all three SMA lines.
- The green SMA crosses the blue SMA on the downside.
- Both the green and blue SMA lines reach below the red SMA.
- The price may start a bearish trend in this state, open a buy order.
- Set an initial stop loss above the crossovers and the current swing high.
- Close the buy position when the downtrend ends.
- The green SMA rises above the blue SMA line.
- Both the green and blue SMA lines rise above the red SMA line.
Key takeaways
- SMA lines show the market context and investors’ sentiment depending on historical data, so check other vital factors before jumping in.
- Don’t forget to use trade and money management rules and never risk more than 2% of your capital while trading using this trading method.
- Check the crossovers carefully before entering the market. Better use a multi-time frame analysis or check the upper timeframe charts to confirm the price direction and current trend.
- To reduce risks when continuing the trade for a longer period, shift your stop-loss levels near the break-even or above/below that level.
Final thought
MA is a standard indicator that traders choose for its effectiveness, availability, simplicity, and easily functional features in the financial world. Many other MA crypto swing trading strategies are available to deal with these volatile asset types.
Note that indicators only show the market context according to historical and currently available data while ignoring fundamental facts. Checking fundamental info before trading using any technical indicator will increase profitability when both suggest the same price movement direction.