Candlestick formations are an unavoidable part of financial trading as it represents the market context according to the participants’ actions. These patterns capture the attractiveness of market players, so expert crypto traders consider various formations while making trade decisions. They allow market participants to make profits in almost any phase of price movement.
However, it is mandatory to identify the candle formations at appropriate places alongside the professionals’ way of use while deciding to use any figure to execute successful trades. This article will discuss the crypto pattern swing trading strategy with chart attachments to better understand.
Chart pattern explained
Several types of figures in the financial market show the price movements, including candlestick charts, bar charts, line charts, etc. The most popular among them is the candlestick chart, as it contains various market data of a particular period such as open, low, high, close, etc. This info help market participants to predict the future directions alongside the current and historical price performance.
Another significant fact of candles is the color of the candle body. Green or white colors are for buying candles while selling candles, usually red or black.

A series of buy candles declares buyers domination on the asset price or a bullish momentum, and for declining price movement, a series of sell candles take place. Shadows or wicks on the candle body represent the peak or lowest price during the candle formation period. It becomes easier to determine swing points or trendy price movement by looking at price candles. Price action traders often enter trades only depending on candle formations.
Why use chart patterns in crypto swing trading
Swing traders usually seek speculative price movements to enter the marketplace. The risk-reward ratios are typically attractive in such trading. Candle formations enable crypto investors to identify swing points through appearances and anticipate the future direction.
For example, a buy candle near any finish line of a downtrend containing a long lower wick represents that sellers may be losing control, and buyers dominate the price when the candle closes or the session ends.
Meanwhile, buy candles continue to occur and reach above the nearest resistance level, a clear decoration that a buy trend may initiate. Moreover, you can easily detect the current movement and the trend-changing environment by looking at candle formations. So crypto swing traders widely choose candlestick patterns to generate profitable trading ideas.
How to use patterns in crypto swing trading?
Market participants with a thorough understanding of candlestick figures can easily executive successful swing trades. Such traders usually spot patterns on adequate levels and anticipate the future price movement by combining the pattern info with other technical data.
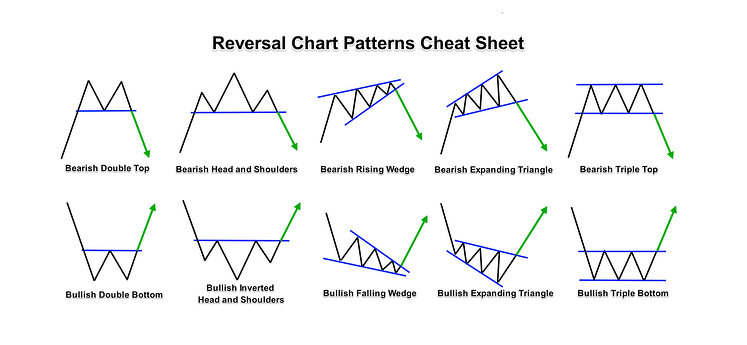
For example, Head and Shoulders (H&S) is a popular reversal candle formation in the financial market that is effective near the finish line of an uptrend and a resistance level. Combining both info, crypto traders can anticipate the current trend, and the price may decline as the H&S figure declares the buyer loses control over the price movement.
Again think of Three black crows near any finish line of an uptrend that may break below short-term support while completing the formation. It indicates an upcoming declining pressure on the asset price and enables a swing to sell trading opportunity.
Many popular figures allow crypto traders to catch swing trades, including Engulfing, Morning star, Evening star, etc.
Chart pattern swing trading strategy
The method seeks Engulfing figures alongside two popular tools:
- MACD
- Volume indicator
Engulfing patterns generate strong signals near the finish lines of any existing trend. Meanwhile, the technical indicators we use to confirm swing points, current direction, and trend strengths. This trading method suits many trading assets. We recommend using an H1 or above time frame chart to catch the most potent swing trades.
Crypto swing trading buy strategy

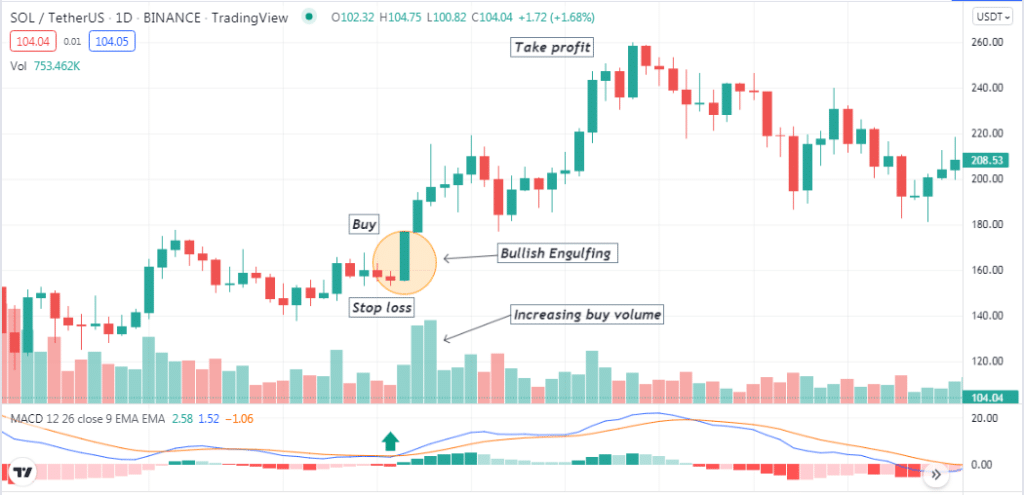
- Spot a bullish Engulfing pattern near any support level, a finish line of a downtrend or in a consolidating phase.
- It should contain a tiny sell candle and a next large buy candle that covers the whole range of that sell candle.
- Confirm that the volume indicator declares an increasing buying pressure.
- Check the dynamic blue line reaches above the dynamic red line at the MACD window.
- MACD green histogram bars take place above the central line.
- Place a buy order confirming all the above scenarios.
- The initial stop loss level will be below the pattern.
- Close the buy order when the indicators confirm the bullish trend is fading or the price starts to decline.
Crypto swing trading sell strategy

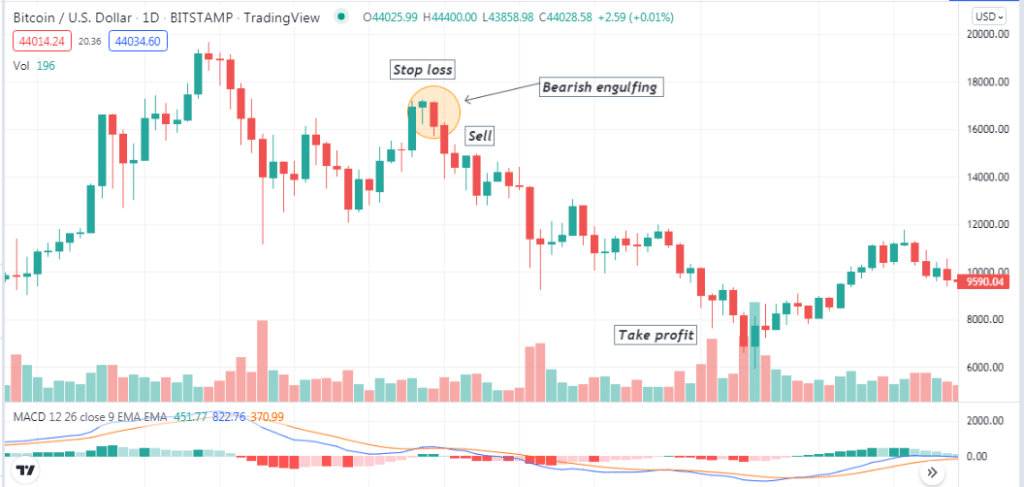
- Spot a bearish Engulfing pattern near any resistance level, a finish line of an uptrend or in a consolidating phase.
- It should contain a tiny buy candle and a next large sell candle covering the whole range of that buy candle.
- Confirm that the volume indicator declares an increasing selling pressure.
- Check the dynamic blue line crosses below the dynamic red line at the MACD window.
- MACD red histogram bars take place below the central line.
- Place a sell order confirming all the above scenarios.
- The initial stop loss level will be above the pattern.
- Close the sell order when the indicators confirm the bearish trend is fading or the price starts to surge upside.
Key takeaways
- There are hundreds of chart patterns available, so better check upper time frame charts to confirm the direction.
- Check the other supportive technical and fundamental factors wisely and appropriately combine them with chart patterns before executing trades.
- Never risk as much as you can’t afford; place tight stop loss according to your trading method.
- Follow specific money and trade management rules.
Final thought
Any crypto investor can use candlestick charts to determine the trend-changing levels, either uptrend or a downtrend. In many cases, candlestick charts don’t usually suggest exact exit points of trades. In those cases, use the help of trading indicators or other technical tools to increase profitability and reduce risk.