As a trader, there is nothing more important than knowing when the price goes up or down. All indicators try to accomplish that. Some have more information, and others are more basic. Although many indicators have been around for decades, this doesn’t mean that traders will stop trying to find better ways to read the market.
In 2010 an interesting new indicator made its appearance in the trading market. To learn how this new indicator changes the way traders read the market and how effective this indicator is, keep reading this entire piece. The lessons learned from old indicators help traders try to develop better signals and fix the mistakes that old tools have.
What is the vortex indicator crypto strategy?
This indicator is one of the most famous and new tools in trading. It’s straightforward to read, and its purpose is to signal when a trend reversal will occur. At the same time, most indicators have been around for decades; the vortex was created in 2010 by Etienne Botes and Douglas Siepman.
This way, the indicator only gives bullish and bearish signals. This characteristic is attractive and problematic since the indicator’s nature avoids misinterpretations but makes it give many false signals, especially in sideways markets.
How to trade using the indicator?
The indicator is made of two lines:
- The VI(+)
- The VI(-)
Behind the behavior of those two lines, there are many mathematic calculations, but for the trader’s purpose, what’s important is that those interactions will signal to enter or exit bullish and bearish trends.
- The trader gets the bullish signal once the trade VI(+) line crosses above the VI(-) line.
- On the other hand, when the VI(-) crosses above the VI(+), traders interpret it as a bearish signal.
The trend depends on which line is above the other.
Bullish trade setup
Like all the other indicators, you should always confirm your signal using different indicators. This is especially true with this indicator since, due to its nature, it has a bullish or bearish bias.
A moving average (MA) is an excellent confirmation indicator for using this tool. Since both are trend-following indicators, the MA will help us avoid false signals.
Where to enter?
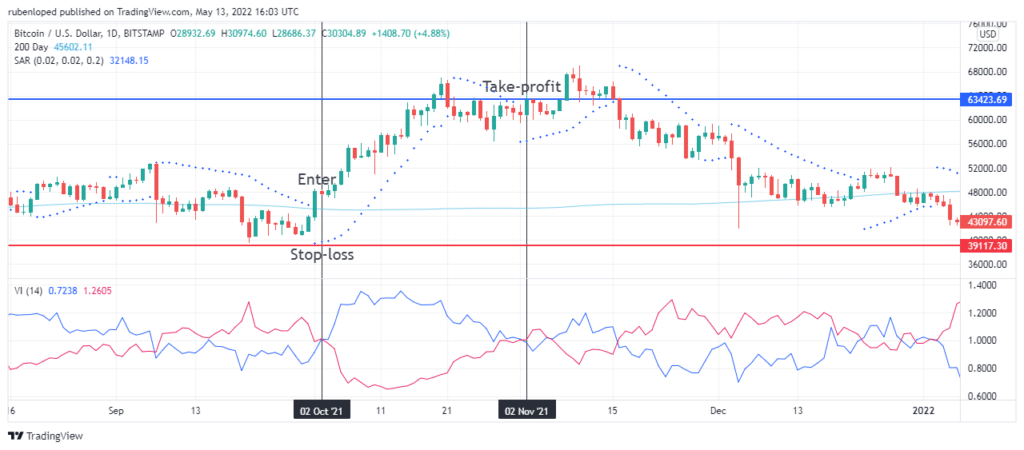
Using the vortex indicator alone, we will enter the trade once the VI(+) crosses above the VI(-). That means to go long on the pair we are trading.
However, we have spoken about false indicators already, so we will now use the 200-periods MA to confirm our signals.
So, we will only enter the trade if the VI(+) line is at the top of the vortex indicator and the price level is above the 200-period MA.
Where to set the stop-loss?
To set the stop-loss, we will use another indicator. Although many traders use the swing low to set their stop-loss, the experience of different traders has shown that using the Parabolic SAR as a stop-loss level is much better.

Where to set the take-profit?
The take-profit level depends again on the vortex indicator. When the VI(+) line crosses below the VI(-) line, it’s time to exit the long position and sell. However, sometimes this signal is a little delayed, and the trader loses some of the earnings he made. Some traders also combined this indicator with the MACD and managed to anticipate the exit signal by paying attention to the MACD.
Bearish trade setup
Since the vortex indicator is a trend-following indicator, it will help us both with the uptrend and downtrend, so using it for bearish trade such a short selling could be a good idea.
Where to enter?
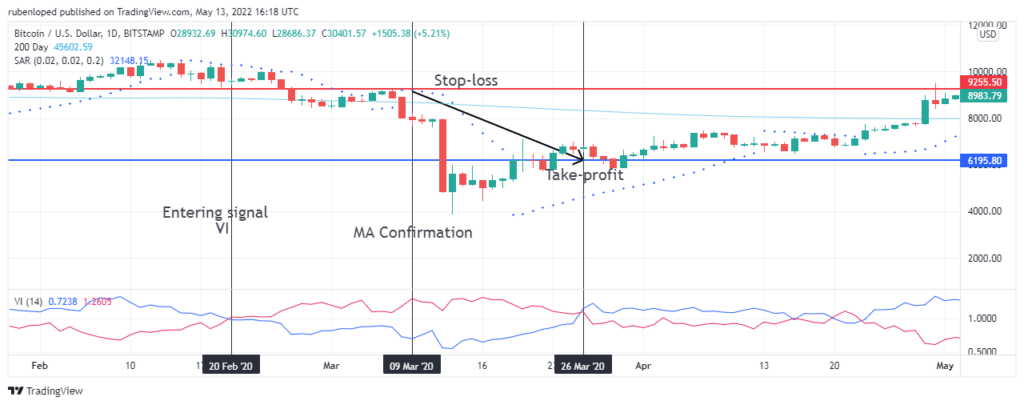
For bearish setups, the enter strategy is very similar. The indicator will tell you to enter the trade once the VI(-) line crosses above the VI(+) line. However, we recommend using other indicators to confirm the trend, especially the 200-period MA. The trader enters the trade as soon as the VI(-) line gets at the top. If the price level is below the 200-period MA.
Where to put your stop-loss?
Again, we’ll use the parabolic SAR to set our SL level. The SL will be just a little above the parabolic SAR to let the trend retrace a little without taking us out of the trade.

Where to set the take-profit?
The take profit level depends again on the vortex indicator. When the VI(-) crosses below the VI(+), that’s the definitive signal to exit the trade.
How to manage risk?
The indicator is straightforward, making it very attractive, but its simplicity makes it vulnerable to false signals. An excellent strategy to handle risk is to use other indicators to confirm your signal. The preferred indicator for this is MACD, parabolic SAR, and MA of different periods.
Also, it’s essential to set clear exit points with stop-loss and take-profit levels and manage an excellent reward-risk ratio. The critical thing to remember is that the earnings should always be long-term.
How to make $500 per day with this strategy?
With this indicator, since its entry and exit point are straightforward, every trader could make several trades during a day, especially in a very volatile market. However, this is not the most recommended practice. Instead, this tool has its best performance in markets with moderate volatility so that the trader can wait for the next large trend. This way, traders avoid false signals and, on average, will make more money.
Final thoughts
This indicator is relatively new, and its effectiveness hasn’t been entirely tested yet. There is plenty of room for improvement. However, even when it hasn’t been around for too long, it’s already a popular indicator since it is straightforward to read, making it very attractive to new traders.
However, new traders are precisely the ones who should be more careful since their lack of practice could make them make more mistakes due to all the false signals the indicator gives in highly volatile.