Technology makes the financial market more accessible to any individual financial investor. The financial market involves a daily trading volume of trillions of dollars, which enables opportunities to make frequent profits based on participating methods, capital size, trading style, etc. The risk and reward are relative factors for any executing trade.
However, many trading methods are available to approach the financial market depending on several facts, including the risk and reward. The best strategies contain an acceptable risk-reward ratio on trade executions. This article will reveal the relationship between the risk and reward of trading besides explaining trading methods with good risk-reward.
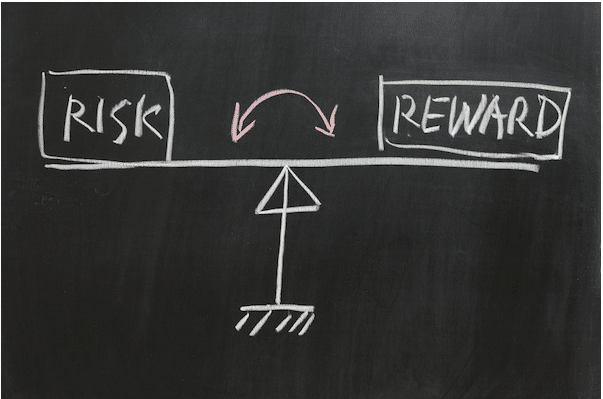
What is the relationship between risk and reward?
The financial market is a vast marketplace for any individual participant. When investing in any financial asset requires approaching the marketplace by following any complete trading method. The financial assets are volatile and unpredictable as many affecting factors are responsible for price movement. So successful traders always seek trading methods that suggest trades with low risks.

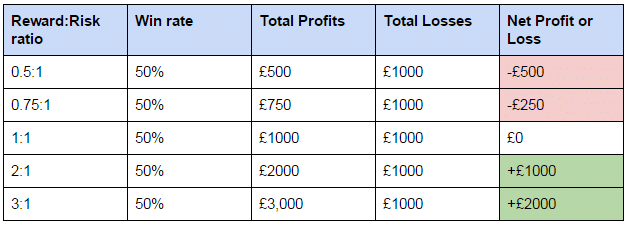
The ultimate goal is to profit or reward by risking a smaller portion of the capital. Most of the time, professional traders take any amount between 2-5% risk of their capital for all executing positions. So for a $100 capital, they only take the risk of $2 when executing trades. The risk-reward ratio is not the same for all traders; it depends on participating entities, capital size, investment duration, and trading methods. For example, day traders often participate in trades that involve a 1:2 risk-reward ratio; meanwhile, swing traders may participate in trades with a 1:3 or 1:4 risk ratio. Any trade with a 1:3 risk-reward ratio means the trader is taking a $1 risk in expectations of gaining a $3 profit.
How to calculate the risk-reward ratio
In financial trading risk-reward ratio means how much you are willing to take risks in the expectation of gaining an amount. For example, suppose a stock price may float near $25. Meanwhile, your trading method recommends opening a buy position here with a stop loss near $20 and a take profit level near $40.

So it is an order with a 1:3 risk-reward ratio as you are risking $5 in expectation to get a $15 profit. The risk-reward ratio calculation is vital to execute trades by minimizing risks and maximizing profits.
A sustainable trading strategy
This part will describe a momentum trading strategy that will enable participating in trades with a good risk-reward ratio. This trading method will use three technical indicators to find entry/exit positions. These indicators will enable you to determine the momentum when the trend is changing or beginning to move in any direction. This trading method determines the volatility, market volume, and trend direction. In this trading method, we use momentum indicators such as moving averages and the MACD.
Three technical indicators are
- Smoothed moving average (SMMA) value of 60.
- An exponential moving average (EMA) value of 50.
- Moving average convergence/divergence (MACD).
This trading method suits any trading instrument in any timeframe. We recommend choosing trading instruments with sufficient volatility and executing trades in the London or US sessions while using smaller time frame charts.
Bullish trade scenario

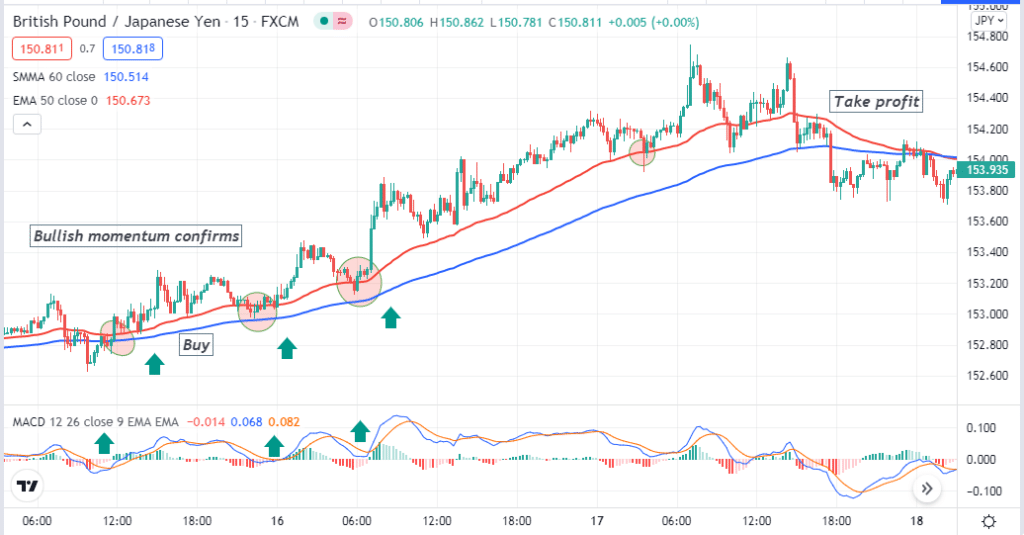
The 15-min price chart of GBP/USD above shows a bullish trade setup by our momentum trading method. When the crossover occurs between the SMMA and EMA lines, it confirms a bullish momentum. When the EMA line crosses above the SMMA line, it declares a positive bullish strength on the asset price. Every time the price comes to the EMA line and bounces upside; the bullish trend remains intact. For more confirmation, we check on the MACD indicator window. The dynamic blue line will cross the dynamic red line on the upside, and green histogram bars above the central line signals to open a buy position.
Entry
According to this trading method, open a buy position when the bullish trend is most potent.
Stop loss
The reasonable stop loss level will be below the bullish momentum where the upside bounce occurs.
Take profit
This trading method usually suggests trading positions with a 1:3-1:4 risk ratio. Set the profit target above 60-80pips when your stop loss is 20pips for your buy order. Otherwise, close the buy position when the EMA line crosses below the SMMA line.
Bearish trade scenario

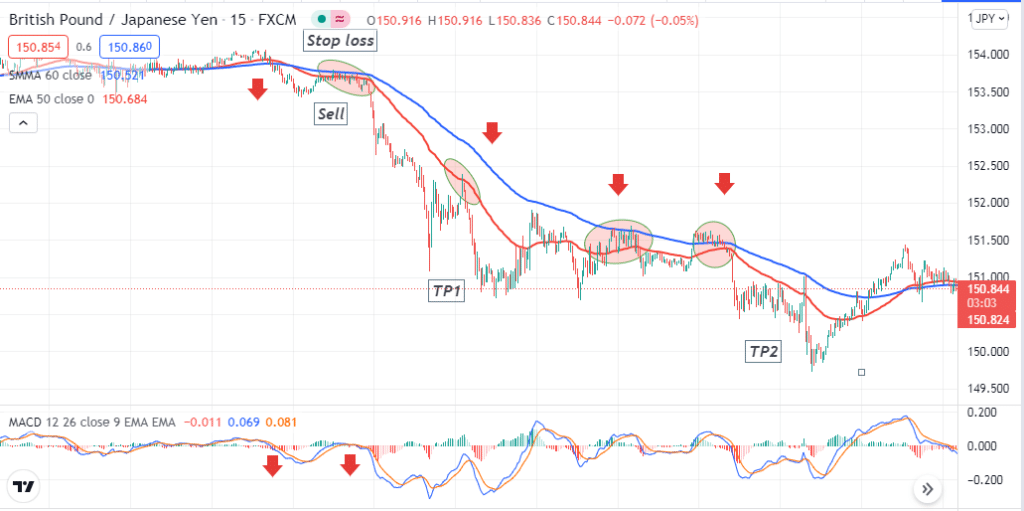
The 15-min chart of GBP/JPY above shows the bearish setup of this trading method which is the exact opposite of the bullish setup. When the declining pressure increases, the EMA line crosses below the SMMA line, signaling a possible upcoming bearish trend. Then check the MACD indicator. The dynamic blue line crosses below the dynamic red line and MACD red histogram bars below the central line. Confirming these appearances on those technical indicators declares it is a potential place to open a sell position. Every time price candles touch the EMA line and use it as resistance confirms the bearish trend remains intact.
Entry
Match these conditions above with your target asset chart and open a buy position.
Stop loss
Use recommendable stop loss above the bearish momentum where the price declines.
Take profit
This trading method suggests trades with a 1:3-1:4 risk-reward ratio. So set a profit target according to your stop loss. Otherwise, close the sell order when the EMA line crosses above the SMMA line.
Pros & cons
| Pros | Cons |
| It allows executing trades with disciplines. | Indiscipline trade executions can lead to incredible losses. |
| It enables avoiding risky trades and increasing profitability. | With risk-reward ratio, it is not a complete trading method. |
| Using an excellent risk-reward ratio is a professional way. | The risk-reward ratio is only a prediction while executing any trade. |
Final thought
The risk-reward ratio is different for traders with various skills and trading methods. It is essential to execute trades with discipline and follow trade and money management rules. Moreover, professional traders always prior check these factors before executing any trade besides confirming trend, strength, volume, etc., other factors.