The rise in cryptocurrency is driving the majority of interest towards itself. Making use of the incredible volatility of cryptos like Bitcoin and a few altcoins is the need.
Technical analysts assume trading movements in the past can be relevant indicators of an asset’s future price movements.
There are a vast number of technical analysis strategies available in the market for you to choose from. But the question arises which one should you choose and use?
Read this article and learn how you can easily trade crypto using technical analysis.
How does technical analysis work?
In this analysis, you examine the market price of an asset by looking into the chart, price movement, and overall trend to determine future price direction.
These forecasts are based primarily on previous price movement data, volume, and the current market price.
There are mainly three types of charts:
- Candlestick chart
- Line chart
- Bar chart
Traders use different strategies like price action, Elliott wave, harmonic pattern to trade the market.
Reason to use for traders and investors
The main reason to use technical analysis is that it is a bit easier than fundamental analysis, where you need to do in-depth market analysis.
If a trader has a specific strategy for technical analysis, they do not need to worry too much and follow their strategy and make continuous changes if required. Technical analysis is less time-consuming, depending on the type of trader you are.
Also, technical indicators are an extra help for these traders. A vast majority of traders or even investors use technical analysis as their trading decisions.
What is crypto technical analysis?
It is a way of reading a crypto asset’s price movement through charts by using different trading strategies.
How to trade crypto using technical analysis?
Although there are numerous strategies to use, the best one to choose is price action, which does not need the usage of technical indicators. Instead, here you will look into the price movement, support & resistance, and trendline and make your trading decisions.
So, starting with the analysis, you first need to move your chart to a 4hr time frame. This will allow you to analyze the overall market trend.
Once you know the market trend-bullish or bearish, you will move to a lower time frame, say 1hr or 30min, decentralized price patterns, rejections, and trade execution. This moving from higher to lower time frame is called multi-time frame analysis.
When trading, you will look for a trend, either down or an uptrend, and wait for the breakout of a range zone. The below section will look into three crypto coin analyses.
Bitcoin: technical analysis example
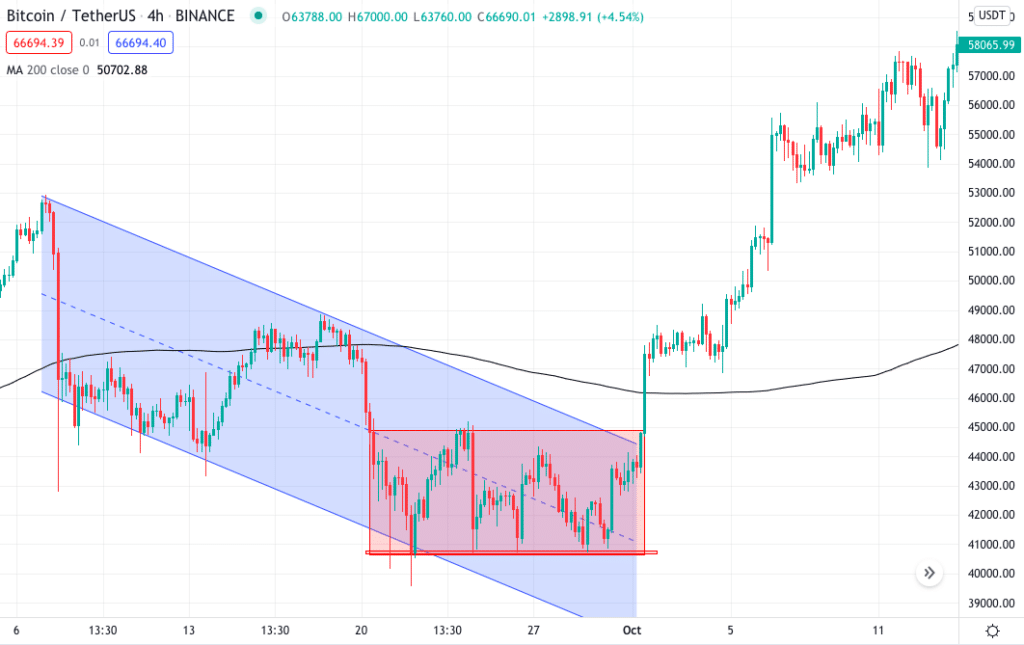
In the BTC/USD chart below, you can see the chart set to a 4hr time frame. The market was moving down and then entered a range zone. After some time, you can see the market breaking the zone and the 200 moving average from down moving up.
The price was also struggling to decrease and could not break the support zone even after significant touches. For better confirmation, you will do the lower time frame.
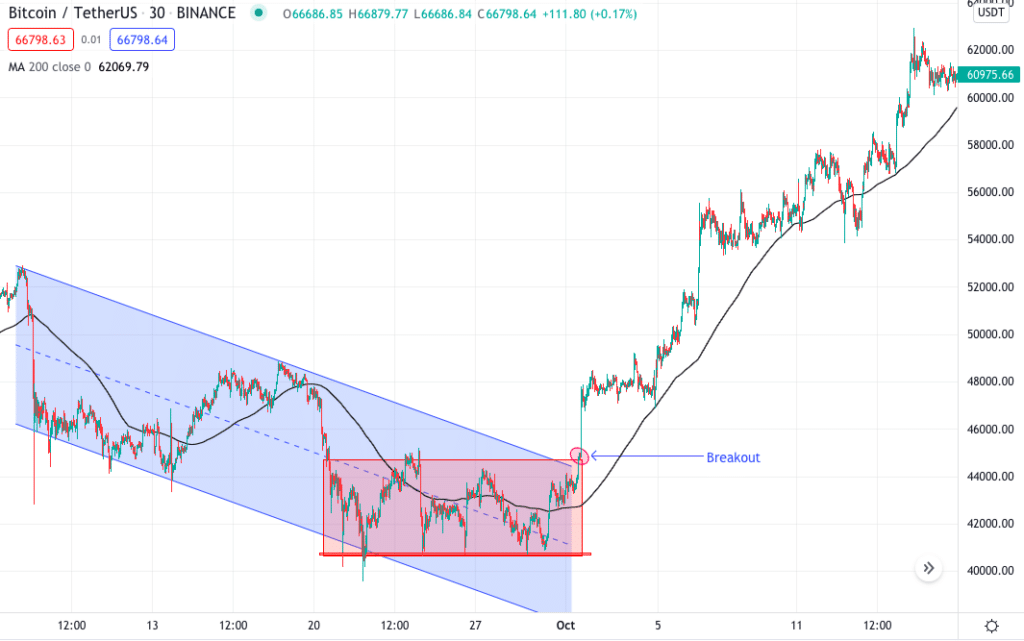
In the lower time frame 30min here, you can see the breakout. This breakout was of the consolidation zone and also the bearish channel. This was a good buying opportunity with three confluences.
Altcoin: technical analysis example
For our altcoin analysis, we will be using BNB, which stands for Binance coin and is currently trading at $500.08.
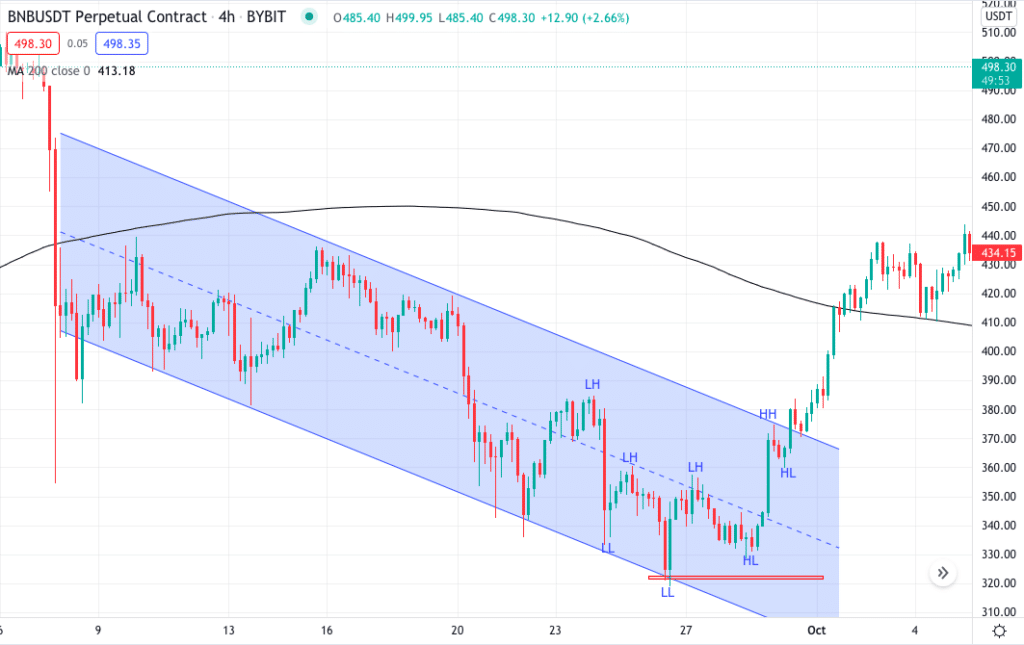
In this below BNB/USDT 4hr chart, you can see the price was down after crossing the 200 moving average. Price was making lower highs and lower lows, but at the last swing low, the price formed a missed double bottom and broke the previous lower high.
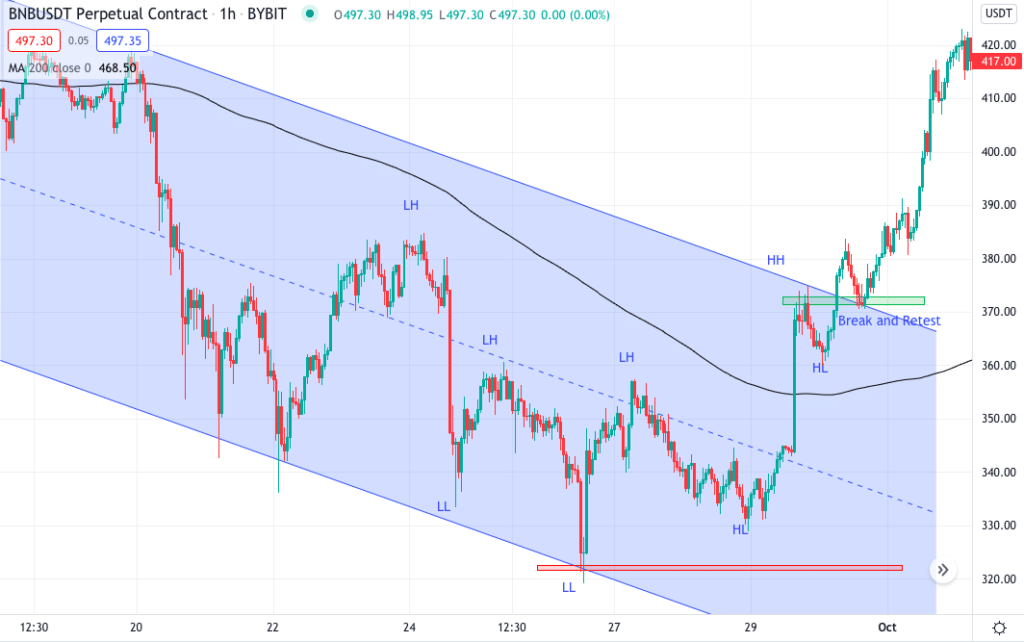
In the lower time frame 1hr, the price moved up and formed a new higher high and a higher low. Moving forward, the next higher high was the break of the bearish channel. The new high formed after the price crossed the 200 moving average.
Furthermore, the price also came and retested the broken zone. The retest here was an extra confirmation for a buying opportunity.
Gaming coin: technical analysis example
For our gaming coin analysis, we will use ENjin, which is currently trading at $1.68.
In the below ENJ/USDT 4hr time frame, we can see the price was moving down after crossing the 200 moving average. Price made several attempts to break the support but was unsuccessful, at this moment entering a consolidation state.
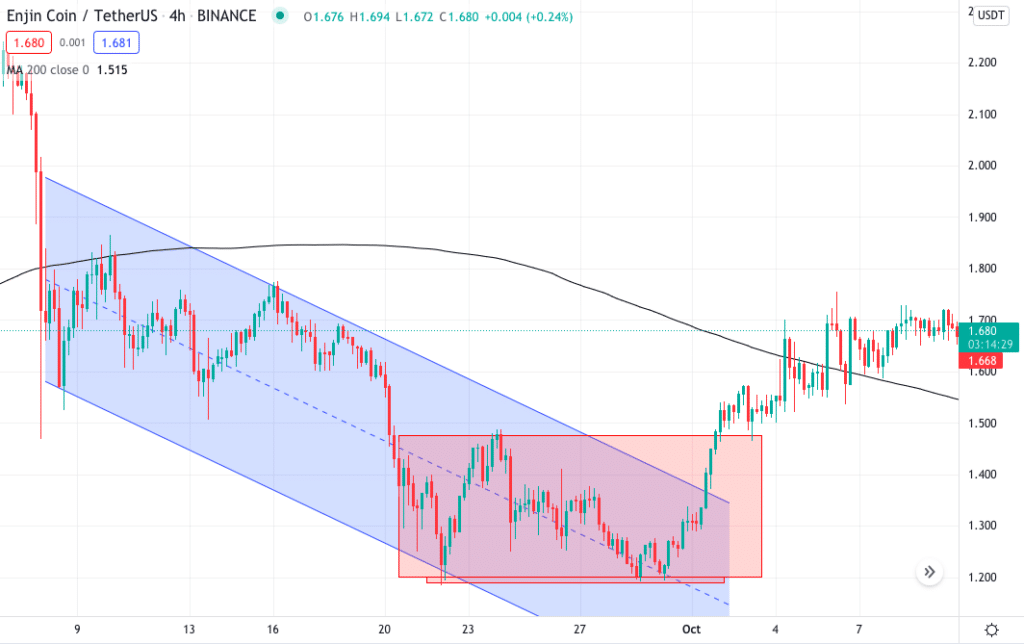
Enjin/TetherUS 4hr chart
In the lower time frame 1hr, the price was struggling to break below the previous low. There was a huge bullish pressure moving forward, and the price broke the bearish channel and the range zone.
The price after breaking the zone came back and retested the broken zone giving buying opportunity.
Pros & cons
You might think crypto trading or investing is what you want to do but pay attention. You must know both the pros and cons before starting.
| Pros | Cons |
| Volatility The higher the volatility, the better the profit. Crypto high volatility can help you make money faster and easier if you do it right. | Volatility Crypto is highly volatile and can be risky for beginners or even intermediate traders. |
| Decentralized Cryptocurrency is a decentralized system meaning no government or single entity has complete control. | Fraud and risk Crypto is a new industry, and this makes it a huge room for scammers. Crypto investing, if done without proper knowledge, is risky. |
| Inexpensive Investing or trading in crypto is very affordable. Here your transaction fees are very less. |
Final thoughts
Crypto is new and still an emerging industry. This in terms might take a lot of time for traders to understand it better. Crypto trading or investing is hazardous, or you can say it’s more than other trading instruments because of its volatility.
Yes, right, volatility. It is good and bad simultaneously, but analyzing which once is it for is you need to understand if you are an aggressive or a moderate trader.
Technical analysis is by far the proper method to trade crypto, but you must never forget to consider the area of confluence. The more the number of confluence, the better.