The foreign exchange market is the largest global platform that oversees the trading of various currencies, commodities, and indices. Millions of traders engage in the exchange of these financial securities and determine the value of each currency.
According to several estimates, there are more than ten million forex traders around the globe. Moreover, the number is increasing as more individuals adopt leverage and margin trading to maximize gains.
However, it is essential to note that though forex trading appears a lucrative domain, it involves considerable risks. Proper knowledge of analyses methods and understanding of forex market dynamics are essential to generate stable gains.
If you are new to trading, correctly interpreting the forex charts is the first step to proceed in this arena. In this article, we have briefly explained the types of forex graphs and how to read them.
What is a foreign exchange market graph?
A forex market graph is the graphical representation of currency pairs’ historical and present price movements. The chart depicts the time on the x-axis and the corresponding price on the y-axis.
To get a short-term or long-term price overview, traders can change the chart time frames from seconds to days or months. Moreover, the forex market graph illustrates the supply and demand of currencies and exhibits the relevant buying and selling pressure.
Forex charts are significant for day traders and technical analysts who study previous price fluctuations to predict future activity. Understanding a forex graph involves detecting the formation of patterns and trends, market sentiment, historical price action, and trend shift signals.
Types of forex graphs and how to understand them
Forex graphs with advanced trading tools are available on brokerage platforms as well as specialized trading websites.
Traders utilize different kinds of charts, indicators, and tools according to their preferences for understanding the behavior of the forex market. Below we have discussed different types of forex graphs and how to read them.
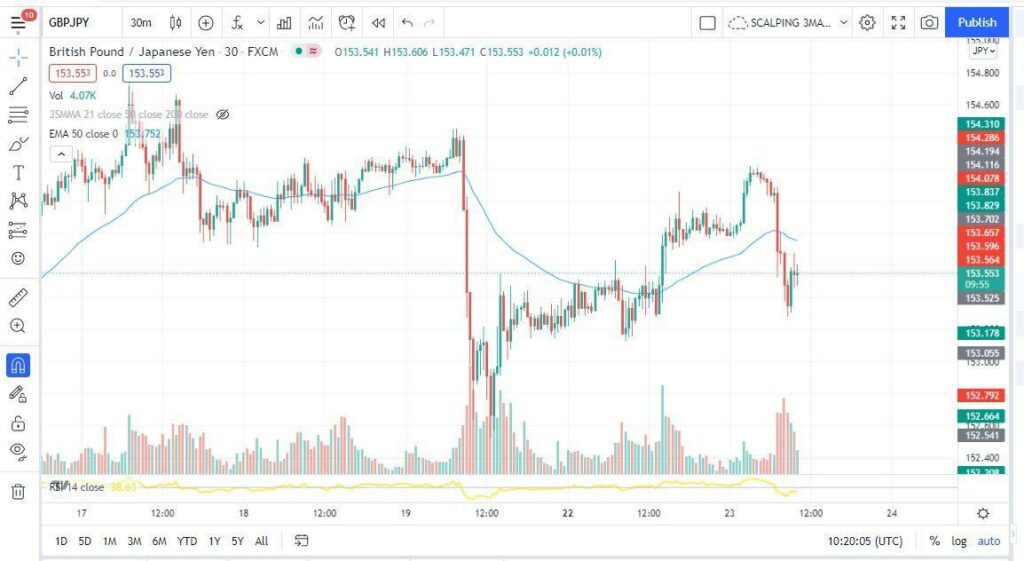
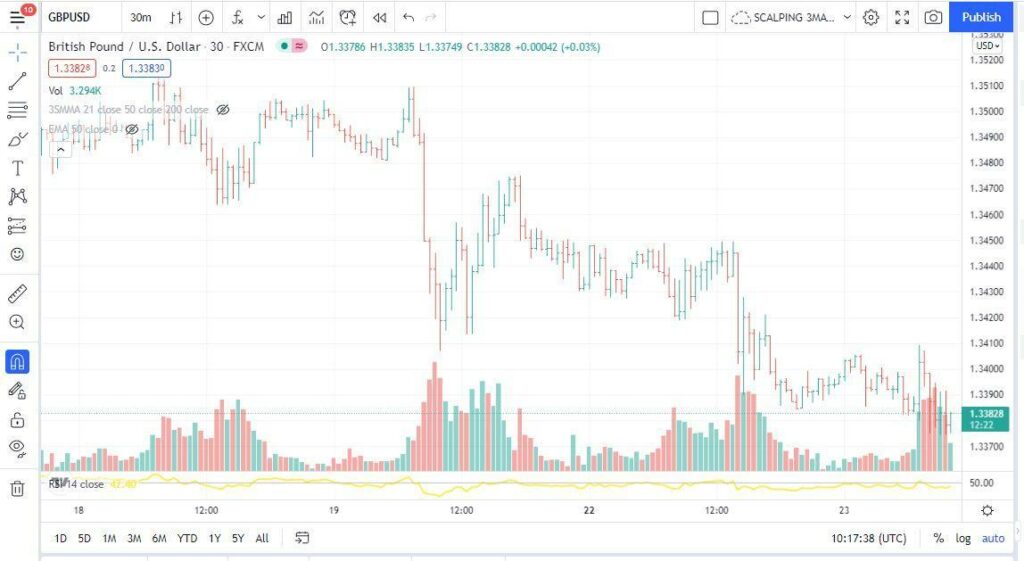
Candlestick chart
A candles graph is the most common charting interface utilized by traders. This chart displays long and thin bars with a body and wicks that resemble a candle. The formation pattern and price range of candles and their opening or closing price portray the price behavior and traders’ psychology.
A candle illustrates the chosen time frame and closes within that specified time range. A 30-minute time frame candle chart would display the candlesticks that incorporate the price movement of half an hour.
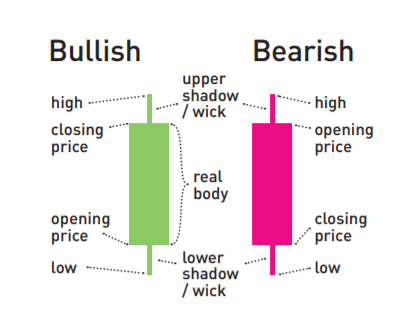
Learning the components of candles and multiple-candle patterns leads to the apprehension of the overall foreign exchange market. The edges of a bullish or bearish candle body stipulate its opening and closing price. In addition, the wicks represent the highest and lowest point the price reached during that candle’s period.
Candlestick patterns
Following are some of the common candle types or patterns that indicate the relative strength of buyers and sellers.
- Engulfing candle
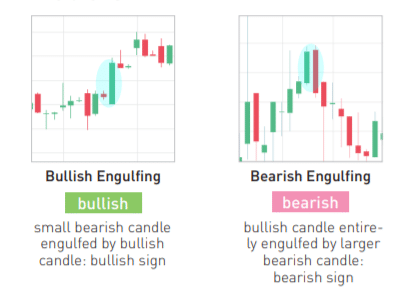
A bullish Engulfing candle is a specific large body bull candle engulfing the previous red candle. The Engulfing candle depicts the buyers’ takeover of the market and forms at the end of a bearish trend.
On the other hand, a bearish engulfing candle points to the imminent sellers’ control and forms at the end of an uptrend.
- Doji
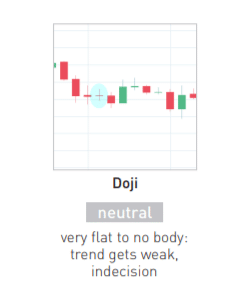
It is the one with merged opening and closing prices and forms a cross. This candle pattern shows the market indecision.
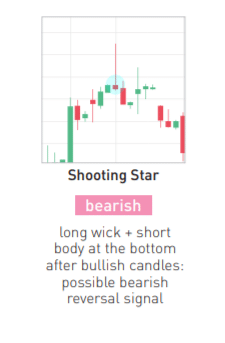
- Hammer and Shooting Star
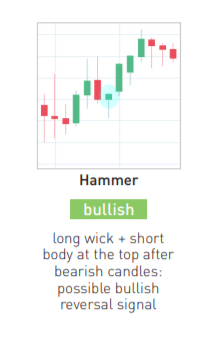
A Hammer candle has a small body with a lengthy downward wick that appears at the base of a bearish trend. This pin bar signifies a tremendous buying pressure that pulls the price back up.
Conversely, a shooting star is a pin bar candle that forms at the top of an upward trend and signals the impending selling bias.
- Evening Star and Morning Star
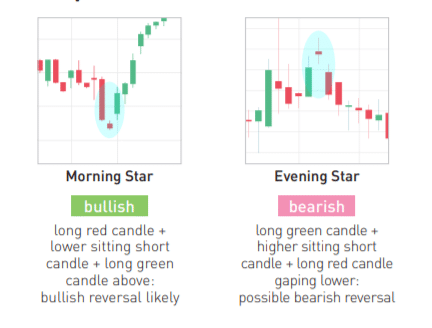
It is a three-candle pattern that signifies the reversal of a prevailing trend. A morning star pattern appears when a short candle forms between a large bearish candle on the left and a big bullish candle on the right. It indicates the termination of a bearish trend.
In contrast, the evening star pattern appears at the conclusion of a bullish trend and marks an intense selling pressure.
- Three White Soldiers and 3 Black Crows
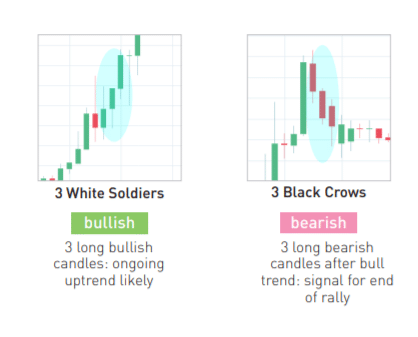
Three White Soldiers indicate a strong buying momentum with the formation of three consecutive and high to high bullish candles. Similarly, traders consider the three crows as a strong bearish signal.
Multiple-candles formations
Several multiple-candle formations indicate a trend continuation, reversal, and suitable trade entry or exit points. These patterns are also relevant in other chart categories, including bar charts and line charts.
Triangular patterns, such as ascending and descending triangles, depicts a trend resumption or reversal according to the triangle formation. In addition, head and shoulders and triple tops or bottoms are significant reversal patterns. Moreover, upward or downward channels, ranging price, and bullish or bearish flags are other common formations.
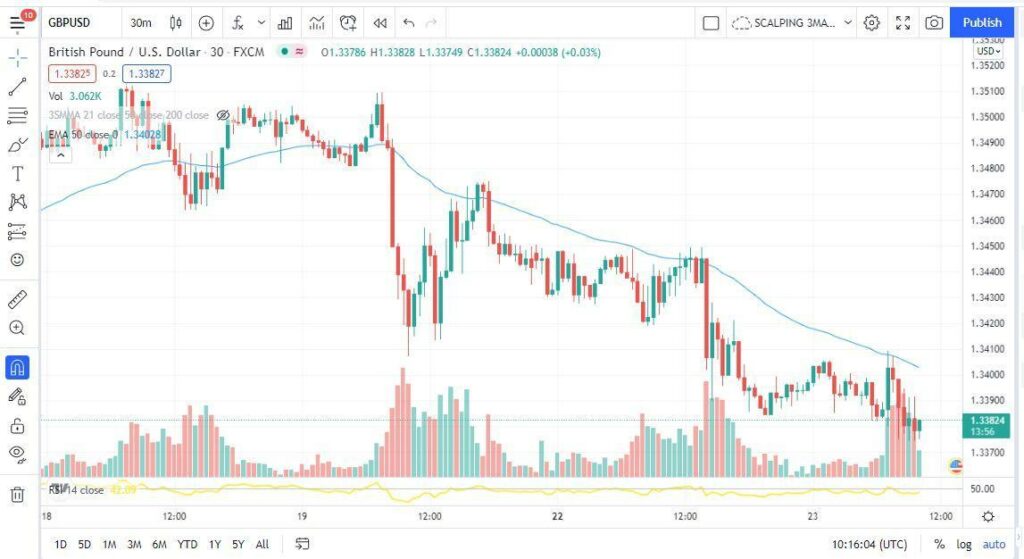
Bar chart
It is similar to the candlestick chart and displays identical information about the price movement. Instead of a candle body, left and right short lines or notches represent the open and close price of the bars.
Generally, green bars indicate a higher closing price than the opening price. In comparison, red bars represent a bearish price movement. In addition, users can choose different time frames for the chart layout.
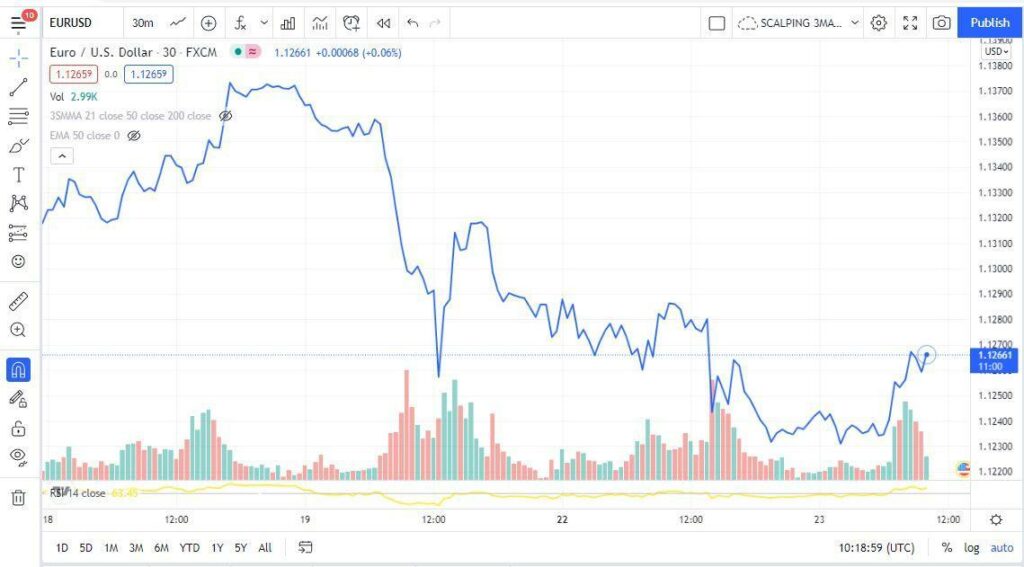
Line chart
They are famous among traders for studying long-term price trends. In a line chart, the closing prices of a specific time frame join end to end with each other.
This type of graph does not give enough present information to traders for effectively scalping and day trading. However, a line chart is suitable for identifying larger trends and reversals.
Forex graphs and technical indicators
Traders almost always utilize several technical indicators on the forex graphs to clearly understand the price variation and its underlying factors. Thousands of technical indicators assist the traders in determining market volatility, price momentum, and trading volumes. Moreover, by utilizing these tools, traders can compare present price swings to previous movements.
Overlay and oscillators are the basic categories of technical indicators that track and measure market activity. The most common indicators are relative strength index, moving averages, Bollinger bands, Fibonacci, and MACD.
Final thoughts
Whether you are a day trader, swing trader, or position trader, clear comprehension of the forex graphs is essential to forecast future price action. The foreign exchange market is a huge global platform that witnesses more than $6 trillion of average trading volume daily.
This enormous trading volume points to the significance of this exchange marketplace. Traders strive to interpret the forex price movements for generating substantial profits. However, success only follows those who attain exceptional skills to correctly decipher the graphs and understand the risks of this margin trading.