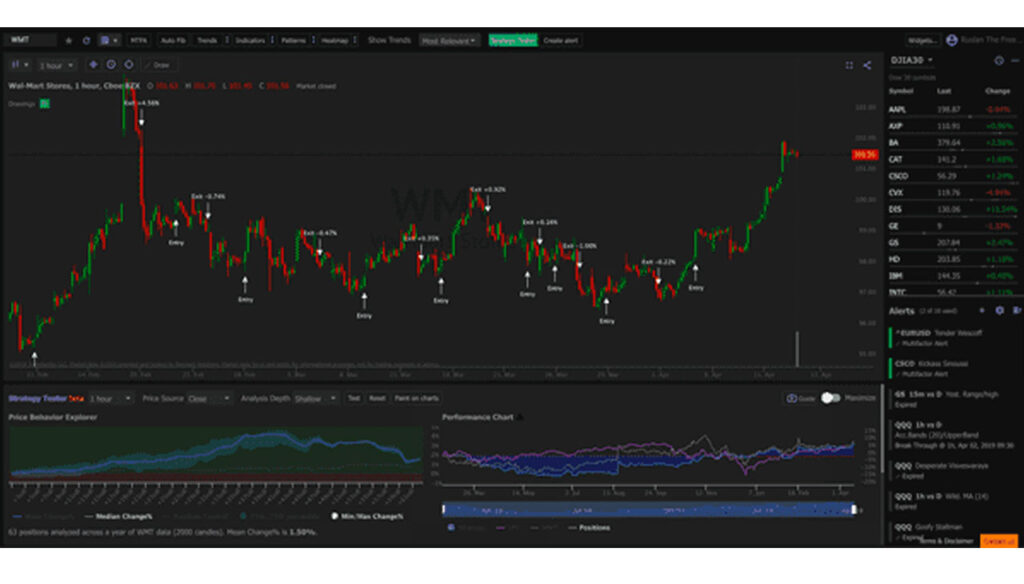
Trend Spider is an advanced technical analysis software tailored to meet the demands of modern traders. This innovative tool offers automated analysis, intelligent drawing tools, and unique time frame functionality, delivering an all-encompassing trading experience. In this review, we will delve into its features, usability, pricing, and support to provide a comprehensive understanding of what Trend Spider brings to the table.

Features
Trend Spider is a powerful technical analysis tool that provides traders and investors with advanced features to analyze market trends and make informed trading decisions. Here are some notable features of Trend Spider:
- Automated Trendline Detection: Trend Spider utilizes artificial intelligence algorithms to automatically detect and draw trendlines on charts. This feature saves time and effort for users, especially technical analysts who heavily rely on trendlines to identify support and resistance levels.
- Multi-Timeframe Analysis: With Trend Spider, users can analyze multiple timeframes simultaneously. This feature helps traders gain a broader perspective on market movements and identify trends and patterns across different periods. It allows for a more comprehensive analysis and helps in making accurate predictions.
- Backtesting and Alerts: Trend Spider allows users to backtest their trading strategies using historical data. Traders can evaluate the performance of their strategies and make necessary adjustments. Additionally, users can set up customizable alerts to stay updated on specific price movements or technical indicators.
- Dynamic Price Alerts: With dynamic price alerts, users can set specific price levels for stocks, cryptocurrencies, or other assets. When the price reaches the set level, Trend Spider sends an alert, allowing traders to take immediate action.
- Risk Management Tools: Trend Spider offers various risk management tools to help traders manage their positions effectively. These tools include position sizing calculators, stop-loss and take-profit levels, and risk-reward ratio analysis.
- Pattern Recognition: Trend Spider employs pattern recognition technology to identify chart patterns such as triangles, wedges, and head and shoulders patterns. This feature helps traders spot potential breakout or reversal opportunities.
- Customizable Technical Indicators: Trend Spider provides a wide range of customizable technical indicators, including moving averages, oscillators, volume-based indicators, and more. Users can personalize these indicators according to their trading strategies and preferences.
- Education and Support: Trend Spider offers educational resources, including webinars, tutorials, and a community forum. Additionally, their support team is available to assist users with any questions or issues they may encounter while using the platform.
In conclusion, Trend Spider is a comprehensive technical analysis tool that offers a multitude of features to help traders analyze market trends and make informed trading decisions. Its automated trendline detection, multi-timeframe analysis, backtesting capabilities, and customizable alerts make it a valuable tool for both beginner and experienced traders.
User Interface and Navigation
Trend Spider features a robust and intuitive user interface, designed with the trader in mind. The layout is clean and organized, making navigation easy even for first-time users. The dashboard provides quick access to all the major functionalities such as charts, backtesting tools, alerts, and market scanners. Traders can seamlessly switch between different timeframes, apply various technical indicators, and manage their watchlists from the main screen. The charting interface is flexible and interactive, allowing users to manipulate trendlines, patterns, and overlays directly on the chart. Furthermore, the platform is customizable, letting traders adjust the color themes, display settings, and chart types to suit their preferences. Overall, the user interface and navigation of Trend Spider are very user-friendly, maximizing efficiency and enhancing the user experience.
Advanced Charting Capabilities
Trend Spider excels when it comes to advanced charting capabilities, setting it apart as a powerful tool for technical analysis. The software provides access to a wide range of chart types including candlestick, line, area, and hollow candles, offering flexibility to suit different trading styles. The high-quality charting canvas supports multiple timeframes and overlays for comparative analysis. Traders can apply a plethora of customizable technical indicators and drawing tools, fostering a practical and personalized charting experience. Furthermore, the platform features automated trendline detection and pattern recognition technology, enabling users to quickly identify potential trading opportunities. Its Raindrop Charts, a unique feature of Trend Spider, offer a novel perspective on volume and price action. These advanced charting capabilities, combined with superior real-time data accuracy, make Trend Spider an invaluable asset in any trader’s toolkit.

Automated Trend Recognition
One of Trend Spider’s standout features is Automated Trend Recognition. This sophisticated technology leverages advanced algorithms and AI to identify and trace trendlines automatically on your selected charts. It eliminates the need for manual drawing and reduces the risk of human error, thereby allowing more accurate and efficient trend analysis. This feature not only recognizes linear trends but also spots more complex patterns such as wedges, channels, and triangles. Its capacity to identify both short-term and long-term trends across multiple timeframes offers traders a comprehensive view of the market. The auto-generated trendlines can be customized according to the trader’s preferences, with options to adjust their color, thickness, and style. This feature considerably streamlines the process of technical analysis, making Trend Spider an essential tool for traders aiming for precise and time-efficient market evaluation.